.svg)
The Voxco Answers Anything Blog
Read on for more in-depth content on the topics that matter and shape the world of research.


Market Research 101
Error to Insight: A Researcher’s Secret Weapon
We may not like to admit it but making mistakes is an expected part of the scientific process. As market and social researchers, we regularly discover errors, learn from them, and improve our processes because of them. You might even say that errors are essential for innovating and generating better insights. From the initial stages of data collection to later stages of results presentation, embracing mistakes is a pathway to better research.
Champion Methodological Mistakes
Plenty of errors are likely to occur during the research design and data collection phase. They reveal unexpected gaps that can be anticipated and prevented in future projects with better training, tools, and processes. How can we embrace these errors?
- Expect flawed data collection tools. Whether you’re working with discussion guides, questionnaires, diaries, or bulletin board outlines, errors such as leading questions, unclear scales, and missing response options are bound to appear. Plan for these problems by including time in the schedule for colleagues to review your tools, perhaps adding incentives for creative solutions. Further, be sure to pilot test the final tool with a few participants prior to the full launch.
- Train for neutrality. As hard as we try to avoid it, questionnaire authors, interviewers, and moderators have feelings and opinions that show up as biased questions, micro-expressions/body language, and tone of voice. This unintentional lack of neutrality can decrease participation rates and distort results. To address this problem, attend refresher training courses on a regular basis. You’ll not only be reminded of common mistakes you may have forgotten about but you’ll also learn new techniques that have gained prominence since your last training.
- Plan for sampling gaps. Every researcher knows how easy it is to recruit a large group of research participants. At the same time, every researcher also knows how difficult it is to recruit participants who are representative of the target population. When budget and field dates are pressuring you, avoid the temptation to overlook representativeness. Build extra time into the schedule and actively oversample difficult target audiences from the beginning to avoid the biases that will result from settling on non-representative samples.
Embrace Analytical Errors
Once data has been collected, the potential for errors doesn’t stop. By embracing errors during the analytical phase, we can achieve more thorough and nuanced data analysis.
- Seek outliers. Sometimes, outliers are discovered to be mistakes like miscodes or shifted columns. These are easily corrected. However, other outliers are analytical puzzles that need to be deciphered. It’s easy to automatically dismiss statistical anomalies but first consider whether they signal an unexpected insight. Mark the anomaly so that once you have a better understanding of the entire research problem, you can go back to it and determine if it was more meaningful than first realized.
- Contradict yourself. As you’re reviewing the analysis and building theories, actively contradict your own ideas. Try to prove the alternative hypothesis. Ask yourself what is missing. Assume errors have been made. Consider if you’ve overgeneralized beyond what the data is telling you. This will help you to avoid the confirmation bias that can arise out of early discoveries.
- Encourage dissent. Throughout your analysis, invite other team members to independently interpret your data. Incentivize them to contradict your interpretations and conclusions with plausible alternatives. And be prepared to put your ideas aside when other ideas are more likely.
- Leverage technology. Rushing through every potentially important theoretical model or statistical analysis is a fast-track to making errors. Use AI tools to dramatically improve your productivity and accuracy. Read our case studies to learn how C+R Research and Frost & Sullivan use Ascribe and Voxco Online to build complex questionnaires and code qualitative data faster, more accurately, and at a lower cost.
Capitalize on Communication Glitches
In many cases, stakeholders review research reports without guidance from the researcher. Consequently, it’s essential that reports are clear, engaging, and powerful.
- Test reports with stakeholders. After spending days and weeks writing a report, your headlines and summaries will seem clear and concise – to you. Schedule sufficient time into your plan so that non-researchers can review it for clarity. Invite them to interpret and mis-interpret charts and tables, and point out conclusions that don’t make sense. Incentives are a great idea here too as many people don’t feel comfortable sharing criticisms of their colleagues’ work.
- Use plain language. As much as you love talking about various statistical tests and study designs with your colleagues, research jargon is not plain language and will not help readers who are further down the chain. Yes, share the jargon as learning opportunities but also incorporate sufficient descriptions so that people who don’t know your jargon will still understand what you’re talking about.
- Highlight limitations. Limitations are not flaws or mistakes. They are acknowledgements that research can never uncover every possible insight regarding every possible scenario. Since no one knows the limitations of the research better than you do, share details about any study constraints during verbal presentations and in the report. Preventing misunderstandings is a key part of your role and your clients will appreciate the guardrails.
Convert Errors into Enhancements
Even the best researchers can’t avoid mistakes. What they do, however, is implement processes to anticipate, detect, and learn from those mistakes. Leverage AI and automation to reduce errors arising out of tedious activities. Collaborate with colleagues and other teams to invite dissenting opinions and alternative insights. Formalize debriefing sessions to identify problems and implement processes to prevent them in future projects.
Remember, mistakes aren’t failures. They’re feedback. By normalizing the presence of errors and fostering a culture of feedback, researchers can improve research validity and methodologies, build trust with stakeholders, and produce more impactful results. Embrace imperfection and the continuous improvement that goes along with it!
If you’d like to work with an experienced team of researchers who also value continual improvement, please get in touch with one of our research experts.
Read more

Text Analytics & AI
How to Choose the Right Solution
Why Ascribe Coder is Better Than ChatGPT at Analyzing Open-Ended Responses
In the age of AI, analyzing open-ended survey responses is more efficient than ever. While general AI models like ChatGPT can process text, they lack the precision, structure, and market research (MR) expertise needed for accurate coding and categorization. Ascribe Coder stands out as the superior choice for researchers, offering a purpose-built solution designed specifically for open-end analysis. Here’s why:
Purpose-Built for Market Research & Survey Analysis
Unlike ChatGPT, which is a general-purpose language model, Ascribe Coder is specifically designed to process, categorize, and analyze open-ended responses. It employs a proprietary method for extracting themes, refined over decades of market research experience. This specialization ensures that responses are coded meaningfully, aligning with industry expectations.
Consistent, Reliable, and Transparent Coding
One of the major drawbacks of ChatGPT is the potential for inconsistent responses due to its generative nature. Ascribe Coder, on the other hand, provides:
- Structured and reproducible coding, with clear parameters and guardrails to keep results focused on the topic.
- Transparency, in the process ensures applied codes stay linked to the original context and meaning within responses.
- Partially coded response reporting, making it easy to review and refine results.
Customizable Codebooks
Ascribe Coder gives users complete control over the codebook or code frame. Researchers can:
- Automatically create descriptive, thematic codebooks tailored to their projects and refine as needed.
- Create code frames with hierarchical and multi-level netting for detailed categorization.
- Save and reuse codebooks for ongoing or similar projects
This level of customization is not possible with ChatGPT, which lacks structured taxonomy management.
Scalability & Efficiency with AI Flexibility
Market researchers often handle large volumes of text data. Sometimes they prefer to use AI assistance for coding, and sometimes they prefer, or are required, not to use AI. Ascribe Coder is built for scalability and flexibility. It:
- Handles large volumes of text with fully automated, fully manual, or hybrid processing to fit user or project needs.
- Offers both generative and non-generative processing modes to suit different analysis needs
In contrast, ChatGPT processes text one query at a time, making it inefficient for large-scale analysis.
Seamless Integration with Market Research Workflows
Ascribe Coder fits seamlessly into research ecosystems, offering:
- Direct integration with survey platforms for smoother data processing.
- Access to Ascribe Coder’s project management system for improved workflow visibility and efficiency.
- Access to MR deliverables when needed for further analysis and reporting.
- Built-in visualization tools, delivering instant insights.
- ASK Ascribe, a tool allowing users to ask questions of the analysis and immediately receive insights, summaries and reports.
Human Oversight of Coding for AI Accuracy & Control
AI should enhance, not replace, human expertise. Ascribe Coder embraces human oversight, enabling researchers to:
- Supervise and customize AI-generated results and make adjustments as needed.
- Use integrated power tools to oversee, refine, and ensure quality control of AI coding.
ChatGPT, in contrast, operates autonomously, making it harder to systematically validate results.
Language Agnostic
Global research often requires analysis of multilingual responses. Ascribe Coder is language agnostic, meaning:
- It can create codebooks and present results in any language, regardless of the input language.
ChatGPT struggles with structured multilingual coding and lacks built-in tools for cross-language consistency.
Exceptional Customer Training and Support
Often times researchers need help with a complex project, training a new team member, or exporting results in a new format. Ascribe’s Customer Training and Support teams have worked for 20+ years in the business and are there to help when needed, ensuring customers receive the results they need from their data to deliver their business objectives. This makes Ascribe a true research companion, far beyond what ChatGPT can offer.
Conclusion
While ChatGPT is a powerful AI model, it was never designed for market research and survey coding. Ascribe Coder delivers structured, transparent, scalable, and customizable text analysis tailored to researchers’ needs. Its proprietary AI, seamless integrations and interactive tools all with human oversight, make it the superior choice for analyzing open-ended responses.
For researchers who demand accuracy, efficiency, and control, Ascribe Coder is the clear winner.
Read more

Market Research 101
Questionnaire Design Misconceptions: 6 Myths That Are Holding You Back
Whether you’re conducting market research, gathering customer feedback, or running an academic study, the quality of your questionnaire can make or break your results. Unfortunately, many people start the process with questionnaire misconceptions that lead to poorly designed surveys and sabotage their efforts before they even begin.
Whether you’re a seasoned researcher or a first-time questionnaire writer, understanding these pitfalls will help you design more effective, engaging, and accurate questionnaires. Let’s debunk the myths, avoid the mistakes, and get on the path to creating surveys that deliver meaningful insights.
Misconception #1: Anyone can write a questionnaire.
Despite how easy it looks, writing a high-quality questionnaire that generates valid and reliable data requires exceptional skill and experience. People are biased, fallible, and take shortcuts. Language is ambiguous, cultural, and plastic. Accommodating for people and language while translating a research objective into a set of questions that will be interpreted in a consistent way by most participants is a complex task. If you’re at the beginning of your questionnaire writing journey, partner with an experienced researcher who can guide and advise you along the way. The truth is, once you’ve gained sufficient expertise and mentorship, anyone can write a questionnaire.
Misconception #2: One size fits all.
Based on their personal experience and education, every researcher has a unique writing style that gets reflected their questionnaires. However, as much as you like your style, it’s not suited for every questionnaire. Younger people might prefer a more gamified survey. People who read English as a 2nd, 3rd, or 4th language might not understand the slang, expressions, idioms, and jargon that are second nature for you. Questionnaires that focus on sensitive issues need empathetic and gentle language. Before writing any questionnaire, researchers must think about their target audience and adjust their writing style to be appropriate for that audience.
Misconception #3: Any question will do.
In many cases, there are unnumerable ways to ask any single question and not one of them is perfect. Single-selects, multi-selects, rankings, ratings, open ends – all these question types could be suitable to ask any consumer, customer, and social behaviors and opinions. However, with experience, you’ll learn that each question type engenders different types of error and interpretations. By choosing a question type, you are also choosing which type of error you are willing to accept. Once you’ve decided what kind of data you need and which errors you can work with, the best questions are clear and concise.
Misconception #4: There is a perfect set of answers.
Just as there are no perfect questions, there are also no perfect answer sets. It’s impossible to say that 5 or 7 or 10 options is the correct number of options. And, it’s impossible to say which set of numbers, brands, or concepts should be included in the set. At some point, you must exclude answers that some people would want to choose in order to create a better experience for the majority of participants. Make sure you’ve got an effective opt-out in place (e.g., Other, Not applicable, None of the above) and then move on.
Misconception #5: People are perfect.
As much as we want participants to read and answer every question perfectly, it’s not going to happen. Researchers rely on sample companies to remove large scale fraud so when we see evidence of that, it’s important to report it back to the company. On the other hand, when we can identify people who are bored, tired, distracted, and not reading carefully, we need to remember that this is normal, human behavior. It’s the researcher’s responsibility to design questionnaires that identify and set aside participants who aren’t having a good day today.
Misconception #6: Questionnaires are boring.
I’m glad to say that questionnaires USED to be boring. Now, we have an abundance of question formats to choose from, including imagery, audio, videos, and gamification. When combined with engaging, fun, and interesting wording, questionnaires never have to be boring again.
Summary
Designing questionnaires is a perfect example of how tasks that appear simple are ultimately revealed to be complex once you dive in. As such, even the best questionnaire designers constantly seek to improve their work. They may seek advice from other experienced researchers, read new questionnaire design books, or take a course to sharpen their skills. Many survey platforms also offer pre-tested, templated questions that have been pre-tested to reduce bias and ensure high-quality results. If you’re seeking some expert guidance, please reach out to one of our survey experts today!
Read more

Market Research 101
Research Participant Rights 101: What Every Social and Market Researcher Needs to Understand
Research guidelines and standards tend to focus on the ideal methodological practices that social and market researchers need to undertake. Though that focus is extremely important, it’s also important to consider research from the point of view of the people who voluntarily take time out of their day to share their thoughts and opinions. Here are 7 core participant rights that researchers should accommodate in any research they conduct.
Consent
“Informed consent’ may be a more popular term but, if you think about it, it is impossible to give consent without first being fully informed. Consent is the entire requirement. Research participants have the right to be informed about a variety of things including:
- General topic and purpose of the research. Exceptions would include where doing so would invalidate the research results. In such cases, the topic and purpose could be revealed after the study is complete.
- The company conducting the research and the name of a person who can answer their questions.
- How their information will be used
- Whether any video or audio recordings will be made
- How much time is required
- What incentives will be offered
- Risks and benefits to their participation
What does this mean for researchers?
Beyond ensuring you share as many details as possible in research invitations, be sure a single contact person is prepared to answer questions posed by potential or current participants. And, ensure that person is easy to reach – participants should not have to send multiple emails or navigate multiple hyperlinks to access them. The onus is on the research company to ensure participants reach that person within one or two efforts.
Voluntary Participation and Withdrawal
Research participants have the right to withdraw their participation at any moment guiltfree and without penalty. This includes not participating in portions or the remainder of a study.
What does this mean for researchers?
While researchers can confirm that a participant wishes to skip a section of or halt the entire study, they may not intimidate or try to coerce participants into continuing. Things could get uncomfortable in a group setting but it’s up to the researcher to ensure the departing participant leaves with grace.
Confidentiality and Privacy
Research participants have the right to control their own information. This includes determining whether and with whom their personal information may be shared, and to have their personal information removed at any point. Participants also have the right to receive a research supplier’s privacy policy with ease and in a reasonable time frame.
What does this mean for researchers?
Most importantly, researchers should ensure their privacy policy is easily available on their website (here’s ours), and can be shared as a hyperlink in email invitations or follow up messaging. Additionally, research companies should have a formal process in place by which a participant’s information can be quickly removed.
Anonymization
Unless they have given consent (which we now know means they have all relevant information), research participants have the right for their information to be fully anonymized.
What does this mean for researchers?
When sharing verbatims in reports, change the details of the individuals involved. Mary becomes Susan, Mohommed become Hussain, Khari becomes Kanan. Even better, age 27 becomes age 29 and age 47 becomes age 46. Further, typos and language style can be preserved while also being altered. Thus, “you aint gonna do nothing” can become “you not gone do nothing.” As researchers, our goal is to preserve concepts, styles, and opinions not make it easy to identify the only woman at the local library who uses the word ‘ain’t.’
Safety
Safety is about more than preventing burnt tongues during a sensory test of soup or preventing cut fingers during a test of an innovative knife handle. Research participants also have the right to know about potential mental or emotional harm that may arise from feeling judged or shamed during discussions of sensitive topics like income, employment, health, sexuality, disabilities, religion, and children.
What does this mean for researchers?
Especially in the case of person-to-person research (e.g., focus groups, individual interviews, telephone interviews), ensure that precautions are taken so people don’t feel embarrassed or harassed by your questions. And, be sure to tell people at the beginning of the study if the topic or any questions could be perceived as sensitive.
Respect
Every research participant, regardless of age, gender, sexuality, disability, religion, and ethnicity, has the right to be treated respectfully during all stages of the research process.
What does this mean for researchers?
Respect plays out in many ways beyond respectful words and communications. As an overlying requirement, researchers must look out for and advocate for participant rights. More specifically, it includes asking only those questions that will actually be analyzed, being honest about how long participation will be, keeping screeners as short as possible, using advanced skip logic and piping to keep surveys short and readable, and ensuring your data collections tools are inclusive. Think about when you’re standing at a customer service desk at a store getting annoyed – this is what you are aiming to prevent with your research experience.
Research Only
Finally, research participants have the right to not be part of bait and switch tactics, whether mugging (marketing under the guide of research), sugging (selling…), or frugging (fund raising…).
What does this mean for researchers?
If you aren’t genuinely conducting research, don’t mislead people into thinking you are. That includes not using PII for direct marketing, list-building or any activities that aren’t directly related to the study and for which consent was not given. If you hope to offer special deals to people at the end of your survey, you don’t need research sample. You need an email or direct marketing list. Don’t damage the reputation of the market and social research industry by misusing research sample.
Summary
Though we’ve identified 7 core participants rights, they could be encapsulated under one single right – the right to be treated with respect. Respect means sharing information, respecting privacy, enforcing anonymity, not misleading people, and listening to people’s needs. By prioritizing respondent rights, market researchers not only comply with ethical and legal standards, they also foster engaged participation, leading to more accurate insights and long-term success. If you’re curious to learn more about our standards of research practice, please get in touch with one of our survey experts.
Additional Resources for Research Participants Rights
- Insights Association Participant Bill of Rights
- ESOMAR/WAPOR GUIDELINE ON OPINION POLLS AND PUBLISHED SURVEYS
- CRIC Public Opinion Research Standards and Disclosure Requirements
- MRIA Charter of Respondent Rights (MRIA no longer exists but the information remains important)
- Standards for the Conduct of Government of Canada Public Opinion Research
Read more

The Latest in Market Research
A Beginner’s Guide to Leveraging AI for Questionnaire Design
AI has emerged as a game-changing tool in the social and marketing insights space, revolutionizing many of our processes. It may seem daunting at first but its potential to improve sampling, research design, data analysis, reporting, and even questionnaire design is unmatched.
Questionnaire design requires a unique blend of art and science, a mix of both technical precision and creative flair, in order to create a positive consumer experience. This makes it a perfect candidate for AI as AI can balance both analytical requirements and imaginative solutions. Below, we consider some of the most effective ways AI can help you craft more impactful questionnaires.
Create a straw dog/draft questionnaire
For some people, putting pen to paper or fingers to keyboard is the most difficult part of the job. In such cases, AI can build a draft questionnaire to stimulate ideas. Give the AI information about key research objective, secondary objectives, target audiences, desired outcomes, and ask for a 30 minute or 50 item questionnaire.
From this overly lengthy questionnaire, you can then identify which types of questions actually meet your needs and cast the others aside. Edit the final result to create a set of questions that meet your needs.
- “Sales of our soda have been declining among people aged 16 to 34 in the southern states. Create a 30-minute questionnaire to help me understand why people are buying less soda and what they want to see changed. See if it has anything to do with people moving out of state or with employment.”
Improve response options
Particularly in countries that are large or have diverse cultural communities, it’s impossible to know all the brands or ideas that should be included in an answer list. AI can easily create a list of 50, 30 or 10 items in order of popularity, awareness, or effectiveness for your consideration. To ensure you’ve got a comprehensive list that can be fine-tuned to your research needs, ask for different categories of options.
While these types of lists can’t be considered perfect or complete, they can turn a thirty-minute brainstorming and desk research task into a five-minute task.
- “List 10 organic supermarkets across the USA.”
- “List 10 independent supermarkets across the USA.”
- “List the 10 least popular supermarkets across the USA.”
- “List the 10 most popular supermarkets across the USA.”
- “List the 2 most popular supermarkets in each state of the USA.”
- “List the 10 most popular supermarkets in big cities across the USA.”
- “List the 10 most popular supermarkets in towns or rural areas across the USA.”
Rewrite awkward questions
Even those of us who write questionnaires every day write questions that are too long, awkward, ambiguous, or complicated. Rather than wasting time pushing words around for 15 minutes, drop the question into an AI tool and ask for five different versions of the question. Chances are you’ll see a couple of configurations that can be edited to better meet your needs.
- “Give me five different versions of this question.”
- “Rewrite this question so it is easier to read by someone who has a 9th grade reading level.”
Write more creative questions
Not only can AI help us improve the grammar and readability of questions, it can also help create more interesting and engaging questions. If you’re not currently in a creative frame of mind, ask your AI to write 20 questions that are fun and creative. From that initial list, you can then choose and edit the best options.
- “Write 20 fun, creative questions about recommending this brand of soda.”
- “Write 20 fun, creative questions about recommending this brand of soda using a five-point scale.”
- “Write 20 questions about recommending this brand of soda. You can use expressions or idioms but make sure people don’t have to know the idiom to understand the question.”
Correct biased or insensitive questions
Language interpretations change so quickly it can be hard to ensure you’ve not unknowingly incorporated controversial language into your questionnaire. AI is a great start for identifying potentially problematic language and suggesting alternatives. Once the AI has done its job and you’ve revised problematic questions, be sure to get final input from experts in language or culture.
- “Identify any insensitive, biased, racist, sexist, homophobic, xenophobic, or other inappropriate language in this questionnaire. Provide alternative wording.”
Write engaging and empathetic exit notes
We’ve all used the templated thank you notes at the end of questionnaires: “Thank you for your participation. You may now close this page.” They’re boring, impersonal, and they don’t send participants off with a genuine feeling of appreciation.
Fortunately, AI can create fun and entertaining notes that send participants off feeling good about the experience. Similarly, AI can build draft personal thank you notes that are more appropriate for serious or sensitive questionnaires.
- “Write five fun thank you notes for the end of a questionnaire about soda.”
- “Write five empathetic thank you notes for the end of a questionnaire about mental health.”
General tips
Using AI to design questionnaires is an easy and safe entry into the AI world. Just remember a few key considerations.
- Start with AI and finish with people. When AI is used to enhance creativity, it will give you amazing ideas that will drastically improve your work. However, it will also come up with ideas that are wrong, irrelevant, and inappropriate. You are the final decision maker and final approvals are always your responsibility.
- Give details ad context. As fantastic as AI is, it can’t read your mind. Give it as much information and context as you can, including any specific sources you’re interested in, being careful to not share any proprietary details.
- Ask for many options and revisions. Unlike working with people, AI won’t get tired, bored, or annoyed if you ask for 50 new ideas and revisions for each one. Every idea has the potential to generate five more ideas, and some of them will be perfect. Keep asking for more creative options and revising until you’re happy to make final edits of the options.
- Don’t worry about grammar, spelling, or how to express your idea. AI is great at decrypting poorly expressed ideas so don’t waste valuable time correcting your spelling or drafting perfect sentences. Write those prompts fast. Not great.
Summary
Designing a questionnaire can be time-consuming and challenging. Fortunately, free AI tools like ChatGPT and DeepSeek can make the process faster, smarter, and more effective. Whether you’re a researcher, marketer, or business owner, you can leverage AI to create more engaging, high-quality questionnaires that deliver actionable insights. With AI, you can say goodbye to guesswork and hello to smarter surveys. If you’re ready to give AI a try, please get in touch with one of our survey experts. We can even show you how AI can be used to code and analyze qualitative data!
Read more

Market Research 101
The Ultimate Guide to Measuring Purchase Intent
Purchase intent (PI) questions are blunt metrics that are known to have a low correlation to actual purchase behavior. However, researchers generally don’t use them solely as indicators of determining the extent to which people are likely to buy something. Instead, these questions help researchers compare brand and product preferences, help product developers understand customer needs, help marketers understand demand, and help sales professionals know where to focus their efforts. They serve a far greater purpose than just estimating purchase intent.
The precise phrasing of PI questions depends on the product and how often or when the product is used or purchased but there are many styles and formats to choose from, especially for researchers working with Fast-Moving-Consumer-Goods (FMCG) like personal care, household, OTC products, pet care, or food and beverage items. Let’s review some of the good, bad, and great ways we can write, design, and program purchase intent questions in marketing research questionnaires.
Boring, Biased Binary Radio Buttons
The simplest way to ask about purchase intent is unfortunately the most biased and least recommended format. By formatting PI as a binary, yes/no question, it becomes a leading question that entices people to “help” the researcher by saying “yes.” As much as possible, avoid binary options for PI questions.
- The next time you shop for detergent, will you buy this brand?
- Yes
- No
Forced Choice Single-Answer
Deservedly so, participants generally don’t like forced choice questions as they don’t allow people to speak their truth. Perhaps they would prefer to go without rather than buy any of them. Or, maybe they would make their own product or borrow some from a friend. However, this question could be appropriate in rare scenarios where there are truly no alternatives apart from the mentioned brands.
- The next time you shop for detergent, which ONE of these brands will you buy?
- Brand A
- Brand B
- Brand C
- Brand D
Multiple-Brand Multiple Choice
Alternatively, consider a multi-brand multiple choice with an opt-out answer option (e.g., Don’t know, Other, None of the above, Won’t buy any). This will appease people who wouldn’t buy any of the brands listed perhaps because they use a cleaning service, someone else does the buying, or they use homemade alternatives. And, it disguises the “correct” answer so people don’t feel like they should “help” the researcher.
- The next time you shop for detergent, which of these brands will you buy?
- Brand A
- Brand B
- Brand C
- Brand D
- Opt-out
Single-Purchase Package Counts
To switch things up, ask about the volume of purchase rather than simply which brands will be purchased. This works particularly well when the product category tends to be purchased in volume or as multiples. A purchase of one could be considered brand trial whereas a purchase of 2 or more could be considered as brand trust. This question could be formatted as one brand in a single answer question or several brands in a grid.
- The next time you shop for detergent, how many of each of these brands will you probably buy?
- The next time you shop for detergent, how many of this brand will you probably buy?
- 0
- 1
- 2
- 3
- 4
- 5 or more
Multiple-Purchase Package Counts
If a product gets purchased frequently over a reasonably short time frame, it might be appropriate to ask not only about the next purchase, but also about the next five or ten purchases. As before, a single package could indicate trial whereas multiple packages could indicate trust. This question could work as a single answer or a grid question.
- Thinking about the next ten packages of detergent you will buy, how many will be each of these brands?
- Thinking about the next five packages of detergent you will buy, how many will be this brand?
- 0
- 1
- 2 or 3
- 4 or 5
- 6 or 7
- 8 or 9
- 10
Single-Brand Balanced Ratings
Rating questions are quite common but also very boring. They are best suited for when you need to compare results to previous questionnaires that used the same format. Typically, these questions are balanced meaning they include a neutral option in the center, flanked by an equal number of negative and positive choices. To prevent bias and to create meaningful comparisons, rating scale questions can also be designed as grid questions that include several brands.
- If these detergents were on the shelf today, how likely are you to buy each of them?
- If this detergent was on the shelf today, how likely are you to buy it?
- Very likely
- Somewhat likely
- Neutral
- Somewhat unlikely
- Very unlikely
Single-Brand Unbalanced Ratings
You might instead consider an unbalanced scale when it is extremely unlikely that people will choose one end of the scale, e.g., a category is loved by 90% of the market. In such cases, the answer options won’t include a neutral middle point. Instead, they will include a range of options from high to low. This can help to spread out the answers.
- On a scale from Extremely interested to Not interested at all, how interested are you in buying each of these brands?
- On a scale from Extremely interested to Not interested at all, how interested are you in buying this brand?
- Extremely interested
- Very interested
- Somewhat interested
- Slightly interested
- Not interested at all
NPS Style
In general, scales that use more than 5 or 7 points are less desirable as they create false precision. But, if they’re asked alongside a couple other NPS style questions, using matched question formats simplifies the participant experience.
- On a scale from 0 to 10, how likely are you to buy this brand the next time you need to buy detergent?
Multiple-Brand Rankings
With ranking questions, we start getting a little more creative. These question formats can be set up in a variety of ways such as having participants type numbers beside brands, click arrows to move brands up and down, or drag and drop brand logos into images of shopping carts. Look through your survey tool to see what creative options are available to you.
- The next time you shop for detergent, which ONE of these brands would you choose first? If that brand wasn’t available, which brand would you choose second and then third?
Timer Questions
Fans of Daniel Kahneman’s System 1 and 2 Theory will appreciate this technique. We know purchase behaviors aren’t completely logical nor critical and question types that rely on speed may trigger more intuitive, emotional thinking. The theory is that asking people to work as quickly as possible will reveal their true opinions. If you’re interested in leveraging speed, make sure to turn on time recordings in your survey tool as those data may not automatically be added to your dataset.
- When you’re ready, I will show you five brands. As fast as you can, click on the ONE brand you are most likely to buy. If you’re ready to begin, click on GO!
- When you’re ready, I will show you five brands. As fast as you can, sort the brands from most likely to buy to least likely to buy. If you’re ready to begin, click on GO!
Let People Speak Their Truth with Single or Multiple Text Boxes and Open Ends
Historically, open-ended questions were time-consuming and expensive to code. Today, however, the availability of AI and automated coding makes them a great option for encouraging people to share their personal truths. Open-ended questions allow people to share brands and details that could never be part of traditional questions such as locally-crafted brands, international brands, or homemade products.
- What brand of detergent will you buy next time? _________________________
Get Creative
So far, we’ve considered different formats or styles of questions but we can do one better by also using engaging and interesting wording. By injecting some creativity, we can encourage participants to slow down and think more carefully. If you’re launching a questionnaire that will only be used once or twice, these kinds of questions are great options.
- If you had to wait in line to buy this brand of detergent, how many minutes would you wait?
- If you had three seconds to run down the store aisle and choose a detergent, which ONE of these brands would you buy?
- If you could only have one brand of detergent for the rest of your life, which brand would you buy?
- If this brand of detergent were on sale for 24 hours, would you click on 'buy' now or wait for another brand?
- If a stranger secretly put this brand of detergent in your shopping cart, would you keep it or remove it?
- If your socks could talk, which brand of detergent would they beg you to buy?
- You’re trapped in a room with your gym clothes after a week of workouts. Which brand of detergent would you buy to wash them?
- If your worst enemy was excited about this brand of detergent, would you buy it?
- If aliens landed on earth and demanded the best detergent, which brand would you buy for them?
Summary
It’s tempting to grab old questionnaires and copy every relevant question word for word. Not only does it speed up the process, it creates consistency among historical and fresh data. But consistency isn’t always necessary and speed doesn’t always generate the level of quality that is essential for understanding consumers’ current needs and desires.
When the opportunity arises, make the effort to get creative. Try a different question format. Try more interesting and engaging wording. Your research participants will thank you with more thoughtful and personally relevant answers.
If you’d like to test out different types of engaging question formats, please get in touch with one of our survey experts. We’d love to show you the full range of options you can choose from!
Read more

Market Research 101
Addressing Data Bias: How Oversampling Improves Accuracy
Oversampling is often misunderstood as a research method that inserts bias into results or data. In this post, we’ll demonstrate that it is, in fact, an important and necessary tool for reducing bias in social and market research. In practice, it requires complicated mathematical calculations, but we’ll set aside the complexities for now to focus on the broad concepts.
Interpretations Are Difficult Without Oversampling
For your marketing or social research project, you might study a sample of 300 people. If we were using a truly random sample, n=300 would give us a margin of error of about 6 percentage points.
Within a sample of 300 people of the USA, there would probably be around 6 people with a PhD (2%), 24 people aged 74 or more (8%), and 45 people in 3 person households (15%). Again, assuming a truly random sample, the margin of error would be about 14 points for the subsample of 45 people in 3 person HHLDs, about 20 points for the subsample of 24 people age 74+, and about 45 points for the subsample of 6 people with PhDs.
Let’s conduct a hypothetical online survey to bring this to life. We’ve asked people whether they want brand new flavor A or brand new flavor B added to their favorite package of fruity candies. Our survey analysis tool reveals that 69% of the 300 people prefer flavor B. Knowing that sampling and non-sampling error can seep into data in many places, we use the margin of error to learn that truth is probably somewhere from 63% to 75%. We can feel confident that, overall, people prefer flavor B.
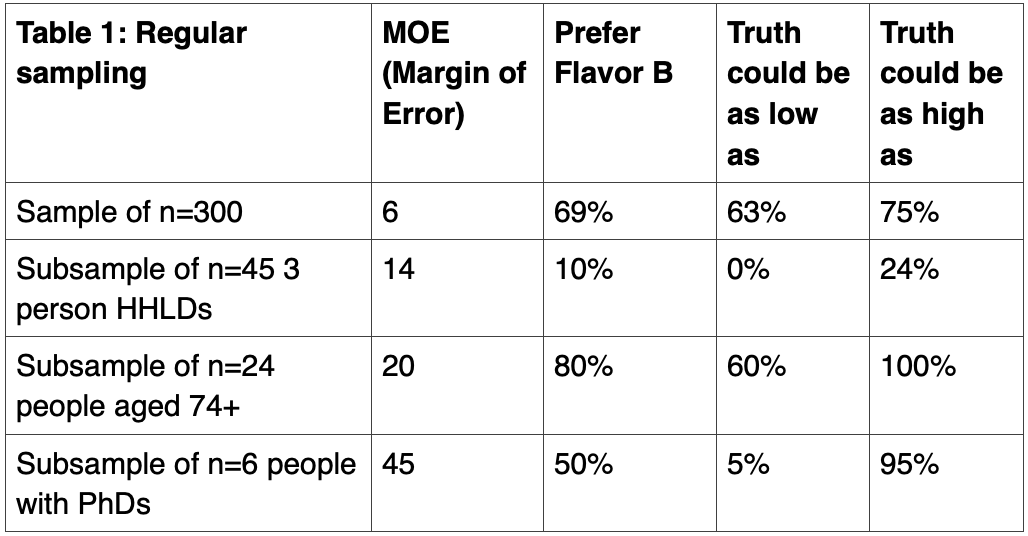
However, interpreting results from the subsamples isn’t simple. Because of their high margins of error, it’s difficult to feel confident about what flavors people prefer. People in three-person HHLDs probably prefer flavor A, as the highest margin of error suggests that up to 25% may prefer flavor B. Meanwhile, people aged 74+ likely prefer flavor B. However, people with PhDs could easily prefer A or B. It’s impossible to know. The huge margins of error for the small subsamples completely obscure true preferences.
Oversampling Brings Confidence to Decision Making
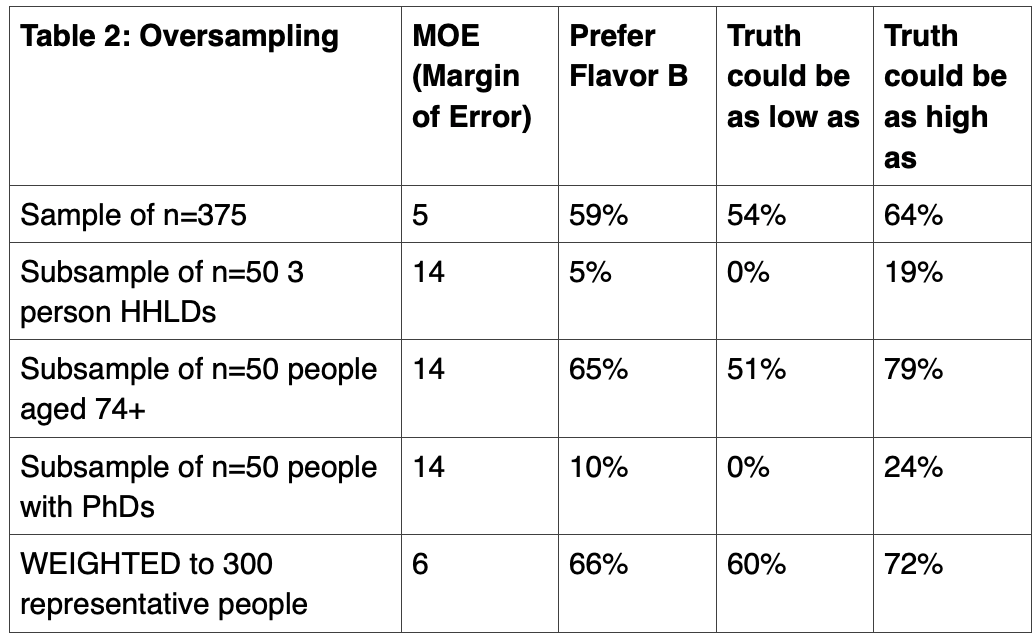
Now, let’s do things differently. Let’s still draw a random sample of 300 people because we need to preserve the demographic characteristics and representation of the population within an appropriately sized sample. But this time, let’s add additional people so that each of the subsamples has 50 people. To the 300, we’ll oversample by 5 people in three person HHLDs, 26 people aged 74+, and 44 people with PhDs for a new total of 375 people.
These additions mean that people in three-person households now make up 13% instead of 15% of the sample, people aged 74+ now make up 13% instead of 8%, and people with PhDs now make up 13% instead of 2%. By increasing each subsample to 50 people, we’ve lost population representativeness, but we’ve improved margin of error.
Now that we have larger subsample sizes, Table 2 shows more precise preference scores among the subsamples: only 5% of people in 3 person HHLDs, 65% of people aged 74+, and 10% of people with PhDs prefer B. After considering the margins of error, we realize that people in 3 person HHLDs prefer A, people aged 74+ prefer B, and people with PhDs prefer A. And, among the entire 375 people, 59% prefer B.
How to Ensure Oversampling Doesn’t Bias Results
Although we can determine that 59% of the 375 people prefer B, this score does not reflect the population because we oversampled on three characteristics. Instead, we need to report a preference score where people in 3 person HHLDs are 15% not 13% of the sample, people aged 74+ are 8% not 13%, and people with PhDs are 2% not 13%.
By weighting the total results back to these percentages, we can determine that 66% of the total sample prefers flavor B. With the margin of error, we know that truth probably lies somewhere between 60% and 72%. We can feel confident that the population would prefer flavor B.
Oversampling gave us two major benefits. First, we discovered that using insufficiently small sample sizes led to overestimated preferences for flavor B among the subsamples. And, we slightly overestimated the overall preference for flavor B among the total sample. By leveraging oversampling, we reduced sample bias and increased precision for both the total sample and the three subsamples.
Summary
Choosing among flavors, shapes, sizes, and colors isn’t necessarily earth-shattering but it can be. For instance, we might need to understand which package shape would make it easier for people to open their medications, which set of instructions would convince more people to finish their medications, or what color signage would draw people into a healthcare facility. There are endless business and research situations wherein it is profoundly important that precision through oversampling and weighting is achieved.
Oversampling and weighting aren’t easy concepts to grasp, and they aren’t statistically simple to implement. Fortunately, because we have specialized software and expert statisticians on our side, most researchers only need to understand why oversampling and weighting are important, how they generally work, and when to report weighted and unweighted results.
If you’re interested to learn more about sampling and weight, please get in touch with one of our survey experts. We’d be happy to help you navigate this essential technique!
Read more

The Latest in Market Research
What Does Committing to an Inclusive Questionnaire Look Like?
Great questionnaires, discussion guides, and other types of survey data collection tools do far more than gather information to effectively answer research and business questions. They create a research environment in which every person participating feels safe and respected enough to share their truthful and complete opinion. It’s not quick or easy to develop such questionnaires but demonstrating to people that researchers truly care about their personal and customer experiences results in much higher data quality. And, it’s the right thing to do. Let’s consider three ways that social and market researchers can strive to achieve inclusivity through questionnaires.
Cultural and ethnic inclusiveness
It’s simple and obvious to say that racist language must never be used in questionnaires or any type of research data collection tool, but this can be difficult to accomplish. Language develops over decades and centuries, and reflects evolving political, cultural, and social perspectives. Our everyday language includes words and phrases that many people don’t realize have racist or sexist histories. For those writing questionnaires about home goods, meetings, or technology, here are just a few phrases with negative histories that need to be replaced.
- Replace “master bedroom” with “main bedroom”
- Replace “brown bag sessions” with “lunch and learn”
- Replace “black list” with “block list”
- Replace “powwow” with “meeting”
- Replace “black sheep” with “outsider”
- Replace “Illegal people” with “non-citizens”
As with the law, ignorance is no excuse. It’s not enough to remove language that is obviously racist or sexist. Researchers with high ethical standards actively seek to identify racist language and remove it from their vocabularies and their questionnaires. A quick Google search will lead you to many resources offering respectful alternatives. And, try uploading your questionnaire to an AI tool to catch any additional racist phrases you missed. Similarly, take care to ensure that questions related to demographic characteristics do not incorporate stereotypical or non-inclusive phrasing, especially if modern phrasings do not mirror your own personal beliefs. For example:
- Replace binary gender options (male/female) with multi-category options that accommodate people who are non-binary.
- Replace stereotypical roles such as housewives, stay-at-home mom, fireman, and policeman with inclusive words like caregiver, homemaker, firefighter, and police officer.
To learn more about creating inclusive demographic questions, review some of these expert resources:
- ESOMAR: Diversity, Equity, and Inclusion
- Insights Association: Guide to: Inclusion, Diversity, Equity, and Access Council Toolkit
- Oregon Health & Science University: Inclusive Language Guide
H2: Disability inclusiveness Today’s technology makes it vastly easier for non-experts to include people who are disabled. Adaptive keyboards, trackballs, head-tracking devices, eye-tracking devices, screen-readers, screen magnifiers, captioning software, and so many other tools mean that people who are disabled have more opportunities to access questionnaires without third-party assistance. However, researchers still need to actively ensure questionnaires are as accessible as possible. First, ignore the thousands of cute and fancy fonts. Stick with simple, clean, and consistent fonts like Arial, Verdana, Helvetica or Calibri, fonts that are much easier for accessibility devices to display and decipher accurately. Avoid emojis, emoticons, ascii art, and fonts that incorporate imagery or shapes as these unnecessary ‘letters’ will be described in several words, thereby interfering with the logical flow of a phrase or sentence. Boring can be a good thing. As we’ve already discussed, language matters. Researchers need to ensure questionnaires use people-first language. Rather than referring to “disabled people,” it’s more respectful to refer to “people who have a disability.” Similarly, replace negative attributions like “Are you wheelchair-bound” with neutral choices like “Do you use a mobility device?” There will always be a few exceptions (such as ‘autistic people’) so make sure to get advice from an expert within the intended population. To learn more about creating documents that are more accessible to people with disabilities, click through to these resources:
- National Center of Deafblindness: Accessibility Toolkit for State Deafblind Projects
- AbilityNet: Creating Accessible Documents
Language Inclusiveness
Finally, language can be a massive barrier to the accessibility of questionnaires. Whether someone is fluent in six languages and is midway through their seventh or if someone knows only English and has a lower skill level, questionnaires must be written to accommodate as many people in the target audience as possible. Without language inclusiveness, only people who have at least the same level of fluency as the researcher will be able to participate in research. The end result is biased responses and potentially wrong research conclusions and business recommendations. What does this mean for questionnaire writers?
- No big words: You finished high school and college. Perhaps you also earned a Master’s degree or a PhD. Your reading skills are much different than the majority of people. As such, you are a biased judge of what words and language most people will understand. The average adult in the USA reads at a grade 9 level. Write for them, not for you.
- No jargon: Jargon isn’t just technical terms that doctors or engineers or factory technicians understand. Jargon includes words like “product category,” “touchpoint,” “pain point,” “targeting,” “user-generated content,” and “gamification.” Just because you see these kinds of words every day doesn’t mean they are part of everyone else’s vocabulary. Say what you mean, not what you report to your manager.
- No Idioms: Like jargon, idioms are meaningless to people whose culture is different than yours. Avoid phrases like “think outside the box,” “raise the bar,” “go the extra mile,” or “push the envelope.” Instead, ask people to think carefully and be creative. Regardless of language skills, most people will understand these words. Once again, boring can be a good thing.
Summary
As researchers, we care deeply about data quality and completion rates. We are desperate to improve data quality so that our results are more valid and reliable. We’re desperate to increase questionnaire completion rates so our results are more generalizable to the intended population. Fortunately, by implementing techniques that make our questionnaires more accessible and inclusive, we accomplish multiple goals. It’s a win-win-win situation. With language and formatting that show people we genuinely care about them, we can improve research experiences in multiple ways. If you’d like to learn more techniques for creating inclusive questionnaires, please get in touch with one of our survey experts. We can help you build a better survey!
Read more

The Latest in Market Research
The Power of 'Why' in Market Research: How to Improve Your Survey Methodology
Every researcher struggles with “the why.” WHY do people behave in a certain way. WHY do people prefer products of a certain shape, size, or color. WHY do people prefer a certain brand. These types of “why” questions often lead researchers to discussions about whether a qualitative or quantitative method is the best option for a particular market research project.
But “why” is not a question reserved for making a decision about using qualitative or quantitative research. Rather, it’s a question that social and market researchers should ask of themselves throughout the entire research process.
Why is your chosen methodology the most suitable methodology?
Researchers who specialize in questionnaire research are extremely skilled at their craft. In fact, they can probably answer any business question you bring to them by designing a comprehensive and detailed questionnaire. Similarly, skilled qualitative researchers can also solve a huge range of business problems with focus groups and IDIs. We know, however, that not every research question is best solved by using your favorite methodology.
- Baseline metrics: Are you seeking baseline metrics of frequency, magnitude, and duration? In such cases, quantitative research is your best option. While most people immediately turn to questionnaires as the best option, there are indeed many other quantitative options. Biometric methods like eye-tracking, EEGs, galvanic skin response, and heart rate variability offer valid and reliable metrics. Similarly, customer data analysis, web analytics and data mining could be more appropriate quantitative methods. Know WHY you chose your specific quantitative method.
- Generalizability: Are you trying to generalize behaviors or emotions from a small group of people to a vastly larger population? For this purpose, you’ll need to start with a fairly large random sample that is representative of the population in terms of key demographics and psychographics. Historically, quantitative methods were the only option but AI innovations have changed that. Today, qualitative research can be conducted at a vastly larger scale as tools like Ascribe can code and analyze vast quantities of qualitative data with high levels of accuracy.
There used to be a clear separation between what quantitative and qualitative research is and what it can do but that is no longer the case. Researchers need to ask themselves why they’re resorting to traditional methodologies when new options are being added to our toolbox every day.
Why are the questions so monotonous?
The bulk of marketing research data collection tools rely on asking people questions. Where do you shop? What do you buy? When do you buy? How many do you buy? Why do you buy? These are straightforward, simple questions. But, reducing our lives to these simple questions negates the complexity of our lives and our decision-making processes. Simple is good, but simple questions elicit shallow, habitual answers rather than deep, personal reflections.
Instead, we need to ask these questions: Why did I phrase the question like that? Why did I choose that set of answers? Why do I always rely on templated questions? Why do all of my questionnaires use the same questions? When we scrutinize our questionnaires in the same way we expect participants to scrutinize their answers, the result is more effective questions.
Simple questions don’t need to be mind-numbingly boring and lacking in complexity to generate thought-out answers. Choose the five most important questions in each questionnaire and take thirty minutes to brainstorm ten alternatives of each. Write out as many preposterous questions as you can. Imagine unusual scenarios, unexpected shopping partners, and unlikely shopping occasions. Aim for strange and unexpected. Even if none of the resulting questions are good, the process will push you towards questions that are more interesting and thought-provoking for your participants.
Why did you choose that type of report?
The fastest way to finish a report is to write it in PPT or Word. It’s what we’ve always done and it’s what clients have always expected. But, there is no reason besides convention that findings need to be shared that way. The purpose of a report is to share or teach a key learning to people, not to create pages of writing. So why did you choose PPT or Word?
Think about what you love to do in your spare time. Maybe you do like to read. In that case, Word might be the perfect type of report for you to receive. Even better, imagine if it took on the flavor of your favorite author and was written as a romance, mystery, or historical fiction novel. That might be the most engaging book you’ll even read and it will certainly be one you’ll remember forever.
Obviously, the creative report needs to be accompanied by an addendum of detailed results but there’s no reason for the most important teaching tool to be prose.
What’s next?
An extremely effective way to achieve business success is to reject the status quo. Instead, ask yourself why. Why did I choose this – because you did in fact choose every aspect of the research process, even if you did it without thinking. Follow up that why with multiple probes until you know for sure that you’re choosing the best path, not the easiest, fastest, or simplest path.
For quantitative researchers, it could mean recommending qualitative interviews with AI coding and analysis for your next project. For questionnaire authors, it could mean rejecting your traditional template and developing a new template replete with creative options that inspire deep thinking. No matter what your why is, it’s sure to put you on the path to more effective and engaging research. We’d love to be on that path so please get in touch with one of our survey experts!
Read more

The Latest in Market Research
Growth Mindset Goals for 2025
This year, forget New Year’s resolutions. Instead, capitalize on your growth mindset and choose goals that fit naturally into your career path. Whether you’re seeking personal growth or business growth, here are a few ideas to get you started!
Get Comfortable with AI
Like it or not, AI is here to stay and it’s changing everything. In the insights industry, it’s infiltrated recruitment, sampling, research design, questionnaire design, interview moderation, data analysis, reporting, and more. There is no avoiding AI.
If you want to remain relevant and happily employed, you have no choice but to engage with and become knowledgeable about AI. You don’t need to become an expert programmer or developer but do need to be able to engage in meaningful conversations and make wise decisions. Here are some fantastic free and paid resources to get you started.
- Coursera: One of my favorite free sources for learning and improving skills, Coursera offers myriad free and paid courses from many accredited institutions you already know and trust. Perfect for beginners, you can sign up for their free online class called, “AI for Everyone” taught by Andrew Ng from Stanford University. This class focuses on understanding the terminology, what to expect from AI, how to use AI, and how to use AI ethically. You don’t need any technology skills or experience to benefit from this course.
- Harvard University: If you want to name-drop and you already know Python, this course is for you. Harvard offers many free courses to the public including an AI class called: “CS50’s Introduction to Artificial Intelligence with Python.” You’ll learn about algorithms, machine learning, AI principles, and how to use AI in Python. Make sure to drop this certification on your LinkedIn page!
- NewMR: If you’d prefer to be more of an observer and soak up tidbits along the way, sign up to receive Ray Poynter’s AI Newsletter. With lots of discussion about how to use AI and notices about webinars and new tools, Ray will keep you up to date with everything insights experts should be aware of. This is a great option for people who feel they’re too old or too far along in their career path to start learning something new – because Ray isn’t!
Increase Your Questionnaire Design Skills
No matter how many years of experience you have writing questionnaires, there’s always someone from a different industry with different experiences who can offer you something new to learn. Whether that’s new types of questions or perspectives you hadn’t considered before, grow your questionnaire design skills with a free or paid class, webinar, or book.
- ESOMAR Academy: Always a wealth of current knowledge, ESOMAR regularly offers online classes including this “Empathetic Survey Design” course by Jon Puleston and Martha Espley. Stuffed with data from their own research, you’re sure to pick up some helpful techniques you’ve not considered before.
- Coursera: The choices on Coursera are unending. Whether you prefer the perspective of psychologists, sociologists, anthropologists, or economists, there is a questionnaire design course for you. For a well-rounded approach, try this “Questionnaire Design for Social Surveys” course offered by the University of Michigan.
- People Aren’t Robots: Skip this option if you don’t like authors plugging their own books! In case you do, “People Aren’t Robots” is a short yet detailed book with lots of examples that will inspire you to write better questionnaires. Taking the point of view that people are imperfect, it offers a rare perspective on how to be kinder to people answering questionnaires.
Be the Change You Want to See
It’s easy to get frustrated when you see your industry moving down one path when you want to take a different path. Fortunately, there’s an easy solution. Join your national association and grab the steering wheel!
- Insights Association: If you’re based in the USA, the Insights Association works on your behalf to champion, protect, and create demand for the insights and analytics industry. Volunteers participate in developing quality standards, education, certification, and more. Get involved with a few small projects to see just how big of an impact you can make.
- CAIP and CRIC: If you’re based in Canada, you’ve got two ways to help steer your national association. Individuals can become Certified Analytics and Insights Professionals and companies can join the Canadian Research Insights Council. In either case, volunteer as a board or committee member, and make your priorities come to life.
- Esomar: Are you ready to take a bold move and create global impact? Then Esomar is your destination! You may feel you’re not yet ready to run for a board position or a National Representative position but there are plenty of other ways to be heard. That might be as part of project committees that work towards specific tasks like guidelines and publications, or program committees that plan events and content. Contact Esomar to find out how you can make your ideas a reality.
What Next?
As the saying goes, the best time to start is right now. Whether it’s January 1st or June 30th, exercise your mind with a course, a webinar, a book, or an email to your national association. And when you’re ready to implement your upgraded questionnaire design skills or test out an AI text analytics and verbatim coding system, talk with one of our survey and AI experts. We’d love to be a part of your growth journey!
Read more