.svg)
The Voxco Answers Anything Blog
Read on for more in-depth content on the topics that matter and shape the world of research.
Inspire. Learn. Create.
Text Analytics & AI
How to Choose the Right Solution
The Latest in Market Research
Market Research 101


Market Research 101
The Ultimate Guide to Measuring Purchase Intent
Purchase intent (PI) questions are blunt metrics that are known to have a low correlation to actual purchase behavior. However, researchers generally don’t use them solely as indicators of determining the extent to which people are likely to buy something. Instead, these questions help researchers compare brand and product preferences, help product developers understand customer needs, help marketers understand demand, and help sales professionals know where to focus their efforts. They serve a far greater purpose than just estimating purchase intent.
The precise phrasing of PI questions depends on the product and how often or when the product is used or purchased but there are many styles and formats to choose from, especially for researchers working with Fast-Moving-Consumer-Goods (FMCG) like personal care, household, OTC products, pet care, or food and beverage items. Let’s review some of the good, bad, and great ways we can write, design, and program purchase intent questions in marketing research questionnaires.
Boring, Biased Binary Radio Buttons
The simplest way to ask about purchase intent is unfortunately the most biased and least recommended format. By formatting PI as a binary, yes/no question, it becomes a leading question that entices people to “help” the researcher by saying “yes.” As much as possible, avoid binary options for PI questions.
- The next time you shop for detergent, will you buy this brand?
- Yes
- No
Forced Choice Single-Answer
Deservedly so, participants generally don’t like forced choice questions as they don’t allow people to speak their truth. Perhaps they would prefer to go without rather than buy any of them. Or, maybe they would make their own product or borrow some from a friend. However, this question could be appropriate in rare scenarios where there are truly no alternatives apart from the mentioned brands.
- The next time you shop for detergent, which ONE of these brands will you buy?
- Brand A
- Brand B
- Brand C
- Brand D
Multiple-Brand Multiple Choice
Alternatively, consider a multi-brand multiple choice with an opt-out answer option (e.g., Don’t know, Other, None of the above, Won’t buy any). This will appease people who wouldn’t buy any of the brands listed perhaps because they use a cleaning service, someone else does the buying, or they use homemade alternatives. And, it disguises the “correct” answer so people don’t feel like they should “help” the researcher.
- The next time you shop for detergent, which of these brands will you buy?
- Brand A
- Brand B
- Brand C
- Brand D
- Opt-out
Single-Purchase Package Counts
To switch things up, ask about the volume of purchase rather than simply which brands will be purchased. This works particularly well when the product category tends to be purchased in volume or as multiples. A purchase of one could be considered brand trial whereas a purchase of 2 or more could be considered as brand trust. This question could be formatted as one brand in a single answer question or several brands in a grid.
- The next time you shop for detergent, how many of each of these brands will you probably buy?
- The next time you shop for detergent, how many of this brand will you probably buy?
- 0
- 1
- 2
- 3
- 4
- 5 or more
Multiple-Purchase Package Counts
If a product gets purchased frequently over a reasonably short time frame, it might be appropriate to ask not only about the next purchase, but also about the next five or ten purchases. As before, a single package could indicate trial whereas multiple packages could indicate trust. This question could work as a single answer or a grid question.
- Thinking about the next ten packages of detergent you will buy, how many will be each of these brands?
- Thinking about the next five packages of detergent you will buy, how many will be this brand?
- 0
- 1
- 2 or 3
- 4 or 5
- 6 or 7
- 8 or 9
- 10
Single-Brand Balanced Ratings
Rating questions are quite common but also very boring. They are best suited for when you need to compare results to previous questionnaires that used the same format. Typically, these questions are balanced meaning they include a neutral option in the center, flanked by an equal number of negative and positive choices. To prevent bias and to create meaningful comparisons, rating scale questions can also be designed as grid questions that include several brands.
- If these detergents were on the shelf today, how likely are you to buy each of them?
- If this detergent was on the shelf today, how likely are you to buy it?
- Very likely
- Somewhat likely
- Neutral
- Somewhat unlikely
- Very unlikely
Single-Brand Unbalanced Ratings
You might instead consider an unbalanced scale when it is extremely unlikely that people will choose one end of the scale, e.g., a category is loved by 90% of the market. In such cases, the answer options won’t include a neutral middle point. Instead, they will include a range of options from high to low. This can help to spread out the answers.
- On a scale from Extremely interested to Not interested at all, how interested are you in buying each of these brands?
- On a scale from Extremely interested to Not interested at all, how interested are you in buying this brand?
- Extremely interested
- Very interested
- Somewhat interested
- Slightly interested
- Not interested at all
NPS Style
In general, scales that use more than 5 or 7 points are less desirable as they create false precision. But, if they’re asked alongside a couple other NPS style questions, using matched question formats simplifies the participant experience.
- On a scale from 0 to 10, how likely are you to buy this brand the next time you need to buy detergent?
Multiple-Brand Rankings
With ranking questions, we start getting a little more creative. These question formats can be set up in a variety of ways such as having participants type numbers beside brands, click arrows to move brands up and down, or drag and drop brand logos into images of shopping carts. Look through your survey tool to see what creative options are available to you.
- The next time you shop for detergent, which ONE of these brands would you choose first? If that brand wasn’t available, which brand would you choose second and then third?
Timer Questions
Fans of Daniel Kahneman’s System 1 and 2 Theory will appreciate this technique. We know purchase behaviors aren’t completely logical nor critical and question types that rely on speed may trigger more intuitive, emotional thinking. The theory is that asking people to work as quickly as possible will reveal their true opinions. If you’re interested in leveraging speed, make sure to turn on time recordings in your survey tool as those data may not automatically be added to your dataset.
- When you’re ready, I will show you five brands. As fast as you can, click on the ONE brand you are most likely to buy. If you’re ready to begin, click on GO!
- When you’re ready, I will show you five brands. As fast as you can, sort the brands from most likely to buy to least likely to buy. If you’re ready to begin, click on GO!
Let People Speak Their Truth with Single or Multiple Text Boxes and Open Ends
Historically, open-ended questions were time-consuming and expensive to code. Today, however, the availability of AI and automated coding makes them a great option for encouraging people to share their personal truths. Open-ended questions allow people to share brands and details that could never be part of traditional questions such as locally-crafted brands, international brands, or homemade products.
- What brand of detergent will you buy next time? _________________________
Get Creative
So far, we’ve considered different formats or styles of questions but we can do one better by also using engaging and interesting wording. By injecting some creativity, we can encourage participants to slow down and think more carefully. If you’re launching a questionnaire that will only be used once or twice, these kinds of questions are great options.
- If you had to wait in line to buy this brand of detergent, how many minutes would you wait?
- If you had three seconds to run down the store aisle and choose a detergent, which ONE of these brands would you buy?
- If you could only have one brand of detergent for the rest of your life, which brand would you buy?
- If this brand of detergent were on sale for 24 hours, would you click on 'buy' now or wait for another brand?
- If a stranger secretly put this brand of detergent in your shopping cart, would you keep it or remove it?
- If your socks could talk, which brand of detergent would they beg you to buy?
- You’re trapped in a room with your gym clothes after a week of workouts. Which brand of detergent would you buy to wash them?
- If your worst enemy was excited about this brand of detergent, would you buy it?
- If aliens landed on earth and demanded the best detergent, which brand would you buy for them?
Summary
It’s tempting to grab old questionnaires and copy every relevant question word for word. Not only does it speed up the process, it creates consistency among historical and fresh data. But consistency isn’t always necessary and speed doesn’t always generate the level of quality that is essential for understanding consumers’ current needs and desires.
When the opportunity arises, make the effort to get creative. Try a different question format. Try more interesting and engaging wording. Your research participants will thank you with more thoughtful and personally relevant answers.
If you’d like to test out different types of engaging question formats, please get in touch with one of our survey experts. We’d love to show you the full range of options you can choose from!
3/3/25
Read more

Market Research 101
Addressing Data Bias: How Oversampling Improves Accuracy
Oversampling is often misunderstood as a research method that inserts bias into results or data. In this post, we’ll demonstrate that it is, in fact, an important and necessary tool for reducing bias in social and market research. In practice, it requires complicated mathematical calculations, but we’ll set aside the complexities for now to focus on the broad concepts.
Interpretations Are Difficult Without Oversampling
For your marketing or social research project, you might study a sample of 300 people. If we were using a truly random sample, n=300 would give us a margin of error of about 6 percentage points.
Within a sample of 300 people of the USA, there would probably be around 6 people with a PhD (2%), 24 people aged 74 or more (8%), and 45 people in 3 person households (15%). Again, assuming a truly random sample, the margin of error would be about 14 points for the subsample of 45 people in 3 person HHLDs, about 20 points for the subsample of 24 people age 74+, and about 45 points for the subsample of 6 people with PhDs.
Let’s conduct a hypothetical online survey to bring this to life. We’ve asked people whether they want brand new flavor A or brand new flavor B added to their favorite package of fruity candies. Our survey analysis tool reveals that 69% of the 300 people prefer flavor B. Knowing that sampling and non-sampling error can seep into data in many places, we use the margin of error to learn that truth is probably somewhere from 63% to 75%. We can feel confident that, overall, people prefer flavor B.
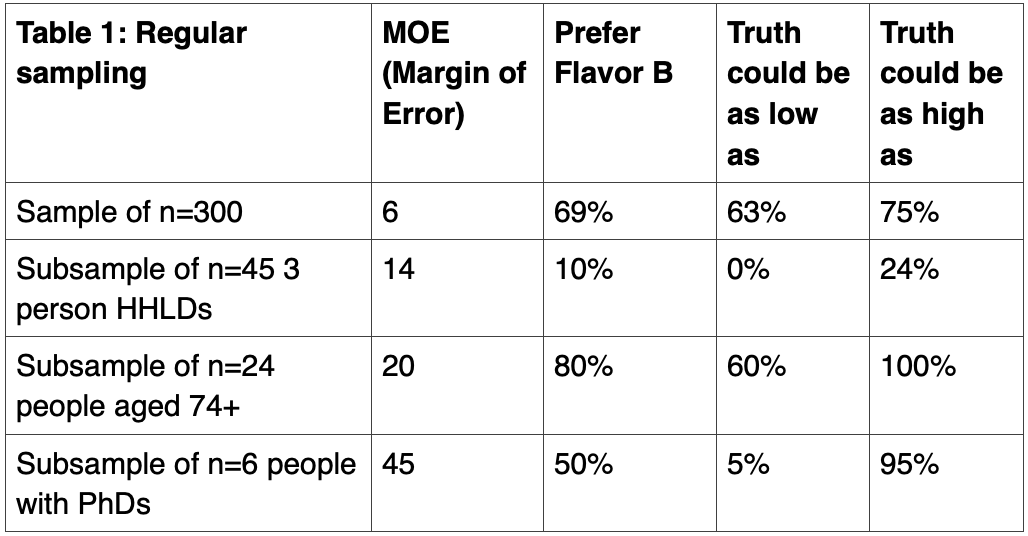
However, interpreting results from the subsamples isn’t simple. Because of their high margins of error, it’s difficult to feel confident about what flavors people prefer. People in three-person HHLDs probably prefer flavor A, as the highest margin of error suggests that up to 25% may prefer flavor B. Meanwhile, people aged 74+ likely prefer flavor B. However, people with PhDs could easily prefer A or B. It’s impossible to know. The huge margins of error for the small subsamples completely obscure true preferences.
Oversampling Brings Confidence to Decision Making
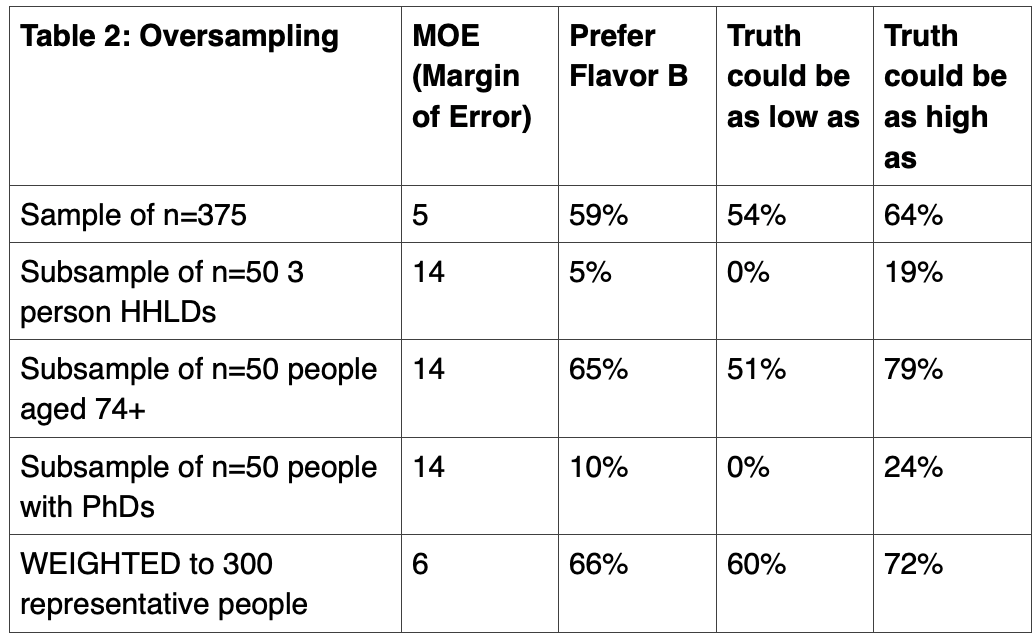
Now, let’s do things differently. Let’s still draw a random sample of 300 people because we need to preserve the demographic characteristics and representation of the population within an appropriately sized sample. But this time, let’s add additional people so that each of the subsamples has 50 people. To the 300, we’ll oversample by 5 people in three person HHLDs, 26 people aged 74+, and 44 people with PhDs for a new total of 375 people.
These additions mean that people in three-person households now make up 13% instead of 15% of the sample, people aged 74+ now make up 13% instead of 8%, and people with PhDs now make up 13% instead of 2%. By increasing each subsample to 50 people, we’ve lost population representativeness, but we’ve improved margin of error.
Now that we have larger subsample sizes, Table 2 shows more precise preference scores among the subsamples: only 5% of people in 3 person HHLDs, 65% of people aged 74+, and 10% of people with PhDs prefer B. After considering the margins of error, we realize that people in 3 person HHLDs prefer A, people aged 74+ prefer B, and people with PhDs prefer A. And, among the entire 375 people, 59% prefer B.
How to Ensure Oversampling Doesn’t Bias Results
Although we can determine that 59% of the 375 people prefer B, this score does not reflect the population because we oversampled on three characteristics. Instead, we need to report a preference score where people in 3 person HHLDs are 15% not 13% of the sample, people aged 74+ are 8% not 13%, and people with PhDs are 2% not 13%.
By weighting the total results back to these percentages, we can determine that 66% of the total sample prefers flavor B. With the margin of error, we know that truth probably lies somewhere between 60% and 72%. We can feel confident that the population would prefer flavor B.
Oversampling gave us two major benefits. First, we discovered that using insufficiently small sample sizes led to overestimated preferences for flavor B among the subsamples. And, we slightly overestimated the overall preference for flavor B among the total sample. By leveraging oversampling, we reduced sample bias and increased precision for both the total sample and the three subsamples.
Summary
Choosing among flavors, shapes, sizes, and colors isn’t necessarily earth-shattering but it can be. For instance, we might need to understand which package shape would make it easier for people to open their medications, which set of instructions would convince more people to finish their medications, or what color signage would draw people into a healthcare facility. There are endless business and research situations wherein it is profoundly important that precision through oversampling and weighting is achieved.
Oversampling and weighting aren’t easy concepts to grasp, and they aren’t statistically simple to implement. Fortunately, because we have specialized software and expert statisticians on our side, most researchers only need to understand why oversampling and weighting are important, how they generally work, and when to report weighted and unweighted results.
If you’re interested to learn more about sampling and weight, please get in touch with one of our survey experts. We’d be happy to help you navigate this essential technique!
2/27/25
Read more

The Latest in Market Research
What does committing to an inclusive questionnaire look like?
Great questionnaires, discussion guides, and other types of survey data collection tools do far more than gather information to effectively answer research and business questions. They create a research environment in which every person participating feels safe and respected enough to share their truthful and complete opinion. It’s not quick or easy to develop such questionnaires but demonstrating to people that researchers truly care about their personal and customer experiences results in much higher data quality. And, it’s the right thing to do. Let’s consider three ways that social and market researchers can strive to achieve inclusivity through questionnaires.
Cultural and ethnic inclusiveness
It’s simple and obvious to say that racist language must never be used in questionnaires or any type of research data collection tool, but this can be difficult to accomplish. Language develops over decades and centuries, and reflects evolving political, cultural, and social perspectives. Our everyday language includes words and phrases that many people don’t realize have racist or sexist histories. For those writing questionnaires about home goods, meetings, or technology, here are just a few phrases with negative histories that need to be replaced.
- Replace “master bedroom” with “main bedroom”
- Replace “brown bag sessions” with “lunch and learn”
- Replace “black list” with “block list”
- Replace “powwow” with “meeting”
- Replace “black sheep” with “outsider”
- Replace “Illegal people” with “non-citizens”
As with the law, ignorance is no excuse. It’s not enough to remove language that is obviously racist or sexist. Researchers with high ethical standards actively seek to identify racist language and remove it from their vocabularies and their questionnaires. A quick Google search will lead you to many resources offering respectful alternatives. And, try uploading your questionnaire to an AI tool to catch any additional racist phrases you missed. Similarly, take care to ensure that questions related to demographic characteristics do not incorporate stereotypical or non-inclusive phrasing, especially if modern phrasings do not mirror your own personal beliefs. For example:
- Replace binary gender options (male/female) with multi-category options that accommodate people who are non-binary.
- Replace stereotypical roles such as housewives, stay-at-home mom, fireman, and policeman with inclusive words like caregiver, homemaker, firefighter, and police officer.
To learn more about creating inclusive demographic questions, review some of these expert resources:
- ESOMAR: Diversity, Equity, and Inclusion
- Insights Association: Guide to: Inclusion, Diversity, Equity, and Access Council Toolkit
- Oregon Health & Science University: Inclusive Language Guide
H2: Disability inclusiveness Today’s technology makes it vastly easier for non-experts to include people who are disabled. Adaptive keyboards, trackballs, head-tracking devices, eye-tracking devices, screen-readers, screen magnifiers, captioning software, and so many other tools mean that people who are disabled have more opportunities to access questionnaires without third-party assistance. However, researchers still need to actively ensure questionnaires are as accessible as possible. First, ignore the thousands of cute and fancy fonts. Stick with simple, clean, and consistent fonts like Arial, Verdana, Helvetica or Calibri, fonts that are much easier for accessibility devices to display and decipher accurately. Avoid emojis, emoticons, ascii art, and fonts that incorporate imagery or shapes as these unnecessary ‘letters’ will be described in several words, thereby interfering with the logical flow of a phrase or sentence. Boring can be a good thing. As we’ve already discussed, language matters. Researchers need to ensure questionnaires use people-first language. Rather than referring to “disabled people,” it’s more respectful to refer to “people who have a disability.” Similarly, replace negative attributions like “Are you wheelchair-bound” with neutral choices like “Do you use a mobility device?” There will always be a few exceptions (such as ‘autistic people’) so make sure to get advice from an expert within the intended population. To learn more about creating documents that are more accessible to people with disabilities, click through to these resources:
- National Center of Deafblindness: Accessibility Toolkit for State Deafblind Projects
- AbilityNet: Creating Accessible Documents
Language Inclusiveness
Finally, language can be a massive barrier to the accessibility of questionnaires. Whether someone is fluent in six languages and is midway through their seventh or if someone knows only English and has a lower skill level, questionnaires must be written to accommodate as many people in the target audience as possible. Without language inclusiveness, only people who have at least the same level of fluency as the researcher will be able to participate in research. The end result is biased responses and potentially wrong research conclusions and business recommendations. What does this mean for questionnaire writers?
- No big words: You finished high school and college. Perhaps you also earned a Master’s degree or a PhD. Your reading skills are much different than the majority of people. As such, you are a biased judge of what words and language most people will understand. The average adult in the USA reads at a grade 9 level. Write for them, not for you.
- No jargon: Jargon isn’t just technical terms that doctors or engineers or factory technicians understand. Jargon includes words like “product category,” “touchpoint,” “pain point,” “targeting,” “user-generated content,” and “gamification.” Just because you see these kinds of words every day doesn’t mean they are part of everyone else’s vocabulary. Say what you mean, not what you report to your manager.
- No Idioms: Like jargon, idioms are meaningless to people whose culture is different than yours. Avoid phrases like “think outside the box,” “raise the bar,” “go the extra mile,” or “push the envelope.” Instead, ask people to think carefully and be creative. Regardless of language skills, most people will understand these words. Once again, boring can be a good thing.
Summary
As researchers, we care deeply about data quality and completion rates. We are desperate to improve data quality so that our results are more valid and reliable. We’re desperate to increase questionnaire completion rates so our results are more generalizable to the intended population. Fortunately, by implementing techniques that make our questionnaires more accessible and inclusive, we accomplish multiple goals. It’s a win-win-win situation. With language and formatting that show people we genuinely care about them, we can improve research experiences in multiple ways. If you’d like to learn more techniques for creating inclusive questionnaires, please get in touch with one of our survey experts. We can help you build a better survey!
2/4/25
Read more

The Latest in Market Research
The Power of 'Why' in Market Research: How to Improve Your Survey Methodology
Every researcher struggles with “the why.” WHY do people behave in a certain way. WHY do people prefer products of a certain shape, size, or color. WHY do people prefer a certain brand. These types of “why” questions often lead researchers to discussions about whether a qualitative or quantitative method is the best option for a particular market research project.
But “why” is not a question reserved for making a decision about using qualitative or quantitative research. Rather, it’s a question that social and market researchers should ask of themselves throughout the entire research process.
Why is your chosen methodology the most suitable methodology?
Researchers who specialize in questionnaire research are extremely skilled at their craft. In fact, they can probably answer any business question you bring to them by designing a comprehensive and detailed questionnaire. Similarly, skilled qualitative researchers can also solve a huge range of business problems with focus groups and IDIs. We know, however, that not every research question is best solved by using your favorite methodology.
- Baseline metrics: Are you seeking baseline metrics of frequency, magnitude, and duration? In such cases, quantitative research is your best option. While most people immediately turn to questionnaires as the best option, there are indeed many other quantitative options. Biometric methods like eye-tracking, EEGs, galvanic skin response, and heart rate variability offer valid and reliable metrics. Similarly, customer data analysis, web analytics and data mining could be more appropriate quantitative methods. Know WHY you chose your specific quantitative method.
- Generalizability: Are you trying to generalize behaviors or emotions from a small group of people to a vastly larger population? For this purpose, you’ll need to start with a fairly large random sample that is representative of the population in terms of key demographics and psychographics. Historically, quantitative methods were the only option but AI innovations have changed that. Today, qualitative research can be conducted at a vastly larger scale as tools like Ascribe can code and analyze vast quantities of qualitative data with high levels of accuracy.
There used to be a clear separation between what quantitative and qualitative research is and what it can do but that is no longer the case. Researchers need to ask themselves why they’re resorting to traditional methodologies when new options are being added to our toolbox every day.
Why are the questions so monotonous?
The bulk of marketing research data collection tools rely on asking people questions. Where do you shop? What do you buy? When do you buy? How many do you buy? Why do you buy? These are straightforward, simple questions. But, reducing our lives to these simple questions negates the complexity of our lives and our decision-making processes. Simple is good, but simple questions elicit shallow, habitual answers rather than deep, personal reflections.
Instead, we need to ask these questions: Why did I phrase the question like that? Why did I choose that set of answers? Why do I always rely on templated questions? Why do all of my questionnaires use the same questions? When we scrutinize our questionnaires in the same way we expect participants to scrutinize their answers, the result is more effective questions.
Simple questions don’t need to be mind-numbingly boring and lacking in complexity to generate thought-out answers. Choose the five most important questions in each questionnaire and take thirty minutes to brainstorm ten alternatives of each. Write out as many preposterous questions as you can. Imagine unusual scenarios, unexpected shopping partners, and unlikely shopping occasions. Aim for strange and unexpected. Even if none of the resulting questions are good, the process will push you towards questions that are more interesting and thought-provoking for your participants.
Why did you choose that type of report?
The fastest way to finish a report is to write it in PPT or Word. It’s what we’ve always done and it’s what clients have always expected. But, there is no reason besides convention that findings need to be shared that way. The purpose of a report is to share or teach a key learning to people, not to create pages of writing. So why did you choose PPT or Word?
Think about what you love to do in your spare time. Maybe you do like to read. In that case, Word might be the perfect type of report for you to receive. Even better, imagine if it took on the flavor of your favorite author and was written as a romance, mystery, or historical fiction novel. That might be the most engaging book you’ll even read and it will certainly be one you’ll remember forever.
Obviously, the creative report needs to be accompanied by an addendum of detailed results but there’s no reason for the most important teaching tool to be prose.
What’s next?
An extremely effective way to achieve business success is to reject the status quo. Instead, ask yourself why. Why did I choose this – because you did in fact choose every aspect of the research process, even if you did it without thinking. Follow up that why with multiple probes until you know for sure that you’re choosing the best path, not the easiest, fastest, or simplest path.
For quantitative researchers, it could mean recommending qualitative interviews with AI coding and analysis for your next project. For questionnaire authors, it could mean rejecting your traditional template and developing a new template replete with creative options that inspire deep thinking. No matter what your why is, it’s sure to put you on the path to more effective and engaging research. We’d love to be on that path so please get in touch with one of our survey experts!
12/18/24
Read more

The Latest in Market Research
Growth Mindset Goals for 2025
This year, forget New Year’s resolutions. Instead, capitalize on your growth mindset and choose goals that fit naturally into your career path. Whether you’re seeking personal growth or business growth, here are a few ideas to get you started!
Get Comfortable with AI
Like it or not, AI is here to stay and it’s changing everything. In the insights industry, it’s infiltrated recruitment, sampling, research design, questionnaire design, interview moderation, data analysis, reporting, and more. There is no avoiding AI.
If you want to remain relevant and happily employed, you have no choice but to engage with and become knowledgeable about AI. You don’t need to become an expert programmer or developer but do need to be able to engage in meaningful conversations and make wise decisions. Here are some fantastic free and paid resources to get you started.
- Coursera: One of my favorite free sources for learning and improving skills, Coursera offers myriad free and paid courses from many accredited institutions you already know and trust. Perfect for beginners, you can sign up for their free online class called, “AI for Everyone” taught by Andrew Ng from Stanford University. This class focuses on understanding the terminology, what to expect from AI, how to use AI, and how to use AI ethically. You don’t need any technology skills or experience to benefit from this course.
- Harvard University: If you want to name-drop and you already know Python, this course is for you. Harvard offers many free courses to the public including an AI class called: “CS50’s Introduction to Artificial Intelligence with Python.” You’ll learn about algorithms, machine learning, AI principles, and how to use AI in Python. Make sure to drop this certification on your LinkedIn page!
- NewMR: If you’d prefer to be more of an observer and soak up tidbits along the way, sign up to receive Ray Poynter’s AI Newsletter. With lots of discussion about how to use AI and notices about webinars and new tools, Ray will keep you up to date with everything insights experts should be aware of. This is a great option for people who feel they’re too old or too far along in their career path to start learning something new – because Ray isn’t!
Increase Your Questionnaire Design Skills
No matter how many years of experience you have writing questionnaires, there’s always someone from a different industry with different experiences who can offer you something new to learn. Whether that’s new types of questions or perspectives you hadn’t considered before, grow your questionnaire design skills with a free or paid class, webinar, or book.
- ESOMAR Academy: Always a wealth of current knowledge, ESOMAR regularly offers online classes including this “Empathetic Survey Design” course by Jon Puleston and Martha Espley. Stuffed with data from their own research, you’re sure to pick up some helpful techniques you’ve not considered before.
- Coursera: The choices on Coursera are unending. Whether you prefer the perspective of psychologists, sociologists, anthropologists, or economists, there is a questionnaire design course for you. For a well-rounded approach, try this “Questionnaire Design for Social Surveys” course offered by the University of Michigan.
- People Aren’t Robots: Skip this option if you don’t like authors plugging their own books! In case you do, “People Aren’t Robots” is a short yet detailed book with lots of examples that will inspire you to write better questionnaires. Taking the point of view that people are imperfect, it offers a rare perspective on how to be kinder to people answering questionnaires.
Be the Change You Want to See
It’s easy to get frustrated when you see your industry moving down one path when you want to take a different path. Fortunately, there’s an easy solution. Join your national association and grab the steering wheel!
- Insights Association: If you’re based in the USA, the Insights Association works on your behalf to champion, protect, and create demand for the insights and analytics industry. Volunteers participate in developing quality standards, education, certification, and more. Get involved with a few small projects to see just how big of an impact you can make.
- CAIP and CRIC: If you’re based in Canada, you’ve got two ways to help steer your national association. Individuals can become Certified Analytics and Insights Professionals and companies can join the Canadian Research Insights Council. In either case, volunteer as a board or committee member, and make your priorities come to life.
- Esomar: Are you ready to take a bold move and create global impact? Then Esomar is your destination! You may feel you’re not yet ready to run for a board position or a National Representative position but there are plenty of other ways to be heard. That might be as part of project committees that work towards specific tasks like guidelines and publications, or program committees that plan events and content. Contact Esomar to find out how you can make your ideas a reality.
What Next?
As the saying goes, the best time to start is right now. Whether it’s January 1st or June 30th, exercise your mind with a course, a webinar, a book, or an email to your national association. And when you’re ready to implement your upgraded questionnaire design skills or test out an AI text analytics and verbatim coding system, talk with one of our survey and AI experts. We’d love to be a part of your growth journey!
12/18/24
Read more

The Latest in Market Research
How to Avoid Fostering False Precision
No matter how careful you are, false precision creeps into research results and reporting. From research design and statistical testing, to a general failure to accept the limitations of people and data, numbers often appear more accurate than they really are. There are a few things researchers can do, however, to try to minimize false precision such that marketers can make more informed business decisions.
Incorporate as much rigor as possible
Researchers have many tools to reduce the potential for false precision but three foundational techniques are particularly important.
First, use the largest sample sizes you can afford. While there is no “best” sample size that applies to every study, it’s fair to say more is better. In the market research space, 700 per group often offers the precision necessary to determine whether two groups are different - in this case, 10% vs 15% will probably be statistically different. When budgets lead to sample sizes of 200 to 300 per group, reliability will decrease and false precision will increase.
Second, use comparison or control groups as often as possible. Without a comparison, it’s impossible to know how much random chance affected the data. Was recall of your brand actually 10% or would 10% of people have recalled a brand you just made up? Did 10% of people try or buy or like or recommend your product or would 10% of people have said the same of a brand you just made up? No matter how careful they are, people will always misremember and misunderstand seemingly obvious things.
Third, when the opportunity arises, use a true random sample. If you’re lucky enough to be working with students registered at a school or cashiers employed in a store, it may be possible to gain consent from a sample of the population. Unfortunately, most market researchers won’t have access to a population list of customers/shoppers/buyers/users and so won’t be able to benefit from this.
Use as few significant digits as possible
Numbers are easy to generate. Throw a questionnaire at 700 people, run chi-squares, calculate pvalues, and build thousand-page tabulations. But those resulting numbers aren’t truth. They are representations of complex subjective constructs based on fallible, unreliable humans. Where truth is 68%, a survey result could be 61% or 69%. To say that 61.37% of people would recommend hypothetical Brand C is a gross misuse of decimal places.
Decimal places are perhaps the most problematic source of false precision, particularly in the marketing research world. To avoid this, don’t use any decimal places when percentage values are between 5% and 95%. Similarly, avoid using two decimal places when reporting Likert results. Only venture into one or more decimal places when you’re working with huge sample sizes from truly random samples.
Even better, if you’re brave and want to express your appreciation for false precision, round 61.37% to ‘about 60%.’
Use statistical testing wisely
Like artificial intelligence, statistical tests are meaningless when they aren’t offered with human oversight.
Tabulation reports can include thousands of t-tests and chi-square tests but, by design, we know that 5% of the significant results are Type I errors. Even worse, we don’t know which of those significant results are false. Because they are easy to find and exciting to report, it’s easy to overuse these significant results. To help readers grasp the concept of false precision, it’s a good idea to share corroborating trends from other sources such as last year’s research report, loyalty data, economic or political data.
If you’re lucky enough to be using random samples, always report margins of error. Further, always report available confidence intervals. While these numbers also incorporate a degree of false precision, readers need reminders that any statistics shared aren’t carved in stone.
Most importantly, ensure your reader understands that any numbers presented are not truth. Rather, they are vastly closer to truth than hypothesizing.
Summary
False precision is an easy trap to fall into, especially when the research results match your hypotheses. It can result in misleading interpretations, flawed decision-making, and ultimately, negative consequences for businesses. However, by being mindful of the limitations of research designs and data reporting, and offering clear instructions on how to best interpret numbers, researchers can help marketers better understand their data and make more informed and accurate decisions. If you’re curious about false precision might present itself in your research, feel free to connect with one of our survey experts!
11/28/24
Read more

Text Analytics & AI
Cautious Innovation: How to Win the AI Race in the Insights Industry
Companies are in a heated race to showcase how their AI innovations help businesses achieve significant gains in processing data more quickly and accurately. But, as with all things, jumping on the bandwagon without a plan is rarely a wise move.
As AI tools developed in a variety of industries over the years, their use has uncovered lessons for future innovators. Here are just a few of those lessons.
Sudden pivots are wise
Though it seems like a lifetime ago, it was only eight years ago that Microsoft released the Tay chatbot. It instantly became a playful conversational tool with cute little quirks. However, people quickly migrated from having fun conversations with it to engaging in more controversial use cases. They realized they could train Tay, and soon taught it to become racist, sexist, and hateful.
This unanticipated outcome led to two important learnings. First, Microsoft reacted quickly and removed Tay from public use. Tay’s removal did not necessarily reflect a failure but, rather, a calculated risk within the innovation funnel. Second, as we’ve already learned from “Privacy by design” methods, the Tay incident reinforced the need for AI tools to incorporate “Ethics by design” models. Thanks in part to Tay, most AI tools now incorporate ethical guardrails. Take the risks, bring your innovations to market, but ensure they are prebuilt with processes to detect and prevent misuse.
Minimum viable standards are relative
Remember when restroom hand dryers with sensors first came out? They worked great for many people, but it soon became apparent that they were unreliable for people with darker skin tones. Developers hadn’t tested the product on people who had darker skin. Across the board, we’ve seen that AI tools are often biased towards pale, male faces because other people are excluded in sufficient quantities from AI training data. As a result, we now have higher minimum standards for training datasets, and we ensure they include people reflecting a wide range of demographics, especially in social and market research.
Our standards have improved over time, but they also differ based on the use case. In the research industry, for example, if you need to code questionnaire verbatims to understand which color of bar soap people prefer, 85% accuracy is suitable for the job. Increasing the 85% to 95% won’t change the outcome of the research but it will take longer and cost more. On the other hand, if you need to understand the efficacy of different mental health therapies, achieving 99% accuracy via automated coding enhanced with manual coding is the better way to go. Life-and- death situations necessitate higher accuracy. Standards are relative.
Ensure people retain final oversight
If you ask several competitive AI image generation tools to create an image of fish in a river, and they all show sushi and maki rolls swimming upstream, that doesn’t make the image valid. In fact, after seeing just one image, people would know the result was invalid.
This is exactly why people are necessary to confirm the validity and accuracy of AI tools. For example, during the development of our qualitative coding tool, Ascribe, we compared the results generated by the AI tool with results generated by expert human coders. It takes time to continually generate results in various industries and topics, and then test those results with human coding. But, that ongoing process is time well-spent to ensure that the quality of AI results is comparable to or better than human results.
Cautious risk-taking will win the AI race
Perfection is elusive, even in the age of AI. Every product, no matter how advanced, has its limitations. While some flaws, like those seen with Tay, might demand drastic changes, most can be addressed with small tweaks or by discovering the optimal use cases. The secret to successful innovation is a balance of bold ideas, agile adaptation, and the courage to take small, calculated risks. If you’re curious to learn more about our approach to using AI wisely, please get in touch with one of our Ascribe or Artificial Intelligence experts.
11/28/24
Read more

The Latest in Market Research
Data to Insight to Action: Choosing the right type of research report
Research reports come in a full range of formats. From short and precise to long and detailed, there’s a report for that. In this post, we’ll outline the pros and cons of three formats to help you choose the one that will best suit your business needs.
Data reports are cheap, fast, and easy
Historically, the research industry has done a great job of producing reports with reams of data. Today, these types of reports are supported by automated systems that produce a nicely colored chart for every single question in a questionnaire. Supplemental charts might also be built manually using data pulled from tabulations. With charts in place, titles or headlines are easily prepared by converting the largest or smallest number in each chart to a phrase.
You know you’re working with a data report when the headlines read like these:
- 75% of shoppers seek out discounts
- 55% of people prefer package B
- 80% of people indicated child-care is a key issue
Data reports are fast and relatively cheap to create. Launch a survey, request the automated charts, and choose an interesting number to become the title on each slide. These reports require little thinking and creativity and, as such, nearly anyone can prepare them regardless of their skill or experience.
Despite their tendency to be quite long, these types of reports answer limited questions. And though automation means that they’re far less expensive, they are the least helpful and are rarely used again. To improve data visualization and streamline reporting, consider integrating dashboards using modern admin panel themes, a quick solution that provides interactive and user-friendly insights into your findings.
Insight reports take time, money, and care
In recent years, our industry has realized that data reports offer little value to research buyers. “What” without the “how, why, and when” doesn’t lead to repeatable business decisions that can be generalized for long-term value across products and audiences. Consequently, many report providers have turned their efforts from data reports to insight reports.
Insight reports require researchers to simultaneously consider multiple pieces of data and derive an understanding that isn’t inherently obvious in the data. It requires understanding the external, environmental context in which the research took place, and how this connects to the business problem at hand.
Insight reports are more expensive and take more time to create because they require more skill and experience to create. Rather than focusing on the largest or smallest number in a chart, researchers instead seek out the unexpected, nonsensical, out of place numbers which are most important. Turning those numbers into insight requires digging into external data – cultural, historical, geographical, political, technological, economic.
Headlines in an insights might look like this:
- Because of the sudden cost of living increase, 50% more shoppers are value seekers
- Despite being less accessible, people preferred Format B because their favorite celebrity was recently seen using it
- The need for child-care declined to 80% due to higher unemployment rates
Although insight reports take more time and money to create, they create value beyond the cost of data collection. They offer insights and understanding that can be used not only for the business problems at hand, but also for other challenges still to come with similar products, categories, or audiences. In the end, these more valuable insights lead to long-term loyalty between the researcher buyer and provider.
Action reports are expensive but they generate ROI
The most valuable reports are action reports. These reports go beyond data points and contextual insights to offer actionable recommendations that identify long-term solutions for specific and generalized business problems. If you were to map out the questions and slides in these types of reports, you wouldn’t find a chart for every question and the slides wouldn’t be ‘in order.’ Rather, you would find that each slide title contributes to an overall coherent story complete with an introduction, key issues, and final conclusions.
Here are some examples of action statements in a report
- With the increased cost of living creating more value seekers, switching to lower quality paper and using less ink on each printing will help decrease prices by 8%
- Despite lower ratings for Format A, it should be adopted with a marketing plan that demonstrates these 3 accessibility use cases
- Though demand for child-care has decreased, we must increase child-care openings to support job-seeking opportunities
Unlike lengthy and less expensive data reports, action reports are usually short and much more expensive mainly because they are vastly more difficult to create. Action reports depend on a true partnership between the research buyer and provider, a partnership wherein the provider has been privy to the confidential workings and challenges experienced by the research buyer. A true partnership leads to reports that offer long-term value and increasing ROI.
Key Takeaways
The choice between data reports, insight reports, and action reports ultimately boils down to your specific business needs. While data reports offer a quick and cost-effective solution, their limited insights may provide no actionable recommendations. Insight reports, on the other hand, dive deeper into the data, uncovering valuable patterns and trends. And, at their best, action reports truly deliver by providing not only insights but also concrete recommendations to drive business growth. The key to success lies in choosing the type of report that aligns with your strategic goals and provides the actionable insights you need to make informed decisions. If you’d like to understand more about research processes, connect with one of our survey experts. We always love chatting about the best ways to uncover valid and reliable insights!
11/21/24
Read more