.svg)
The Voxco Answers Anything Blog
Read on for more in-depth content on the topics that matter and shape the world of research.


Inspire. Learn. Create.
Text Analytics & AI
How to Choose the Right Solution
The Latest in Market Research
Market Research 101
.jpeg)

Text Analytics & AI
Transform Open-End Analysis into Precise Results with Theme Extractor 2.0 and Ask Ascribe
Market researchers and data analysts are constantly looking for faster and more efficient ways to analyze and extract actionable insights from vast amounts of open-end feedback. The launch of Theme Extractor 2.0 and Ask Ascribe marks a major leap forward in open-end analysis, equipping organizations with advanced tools that offer exceptional speed, precision, and depth of insight.
Let’s explore how these innovative solutions enhance Coder, Ascribe’s verbatim coding platform, and CX Inspector, Ascribe’s text analytics solution, along with how they can improve your workflow.
What is Theme Extractor 2.0?
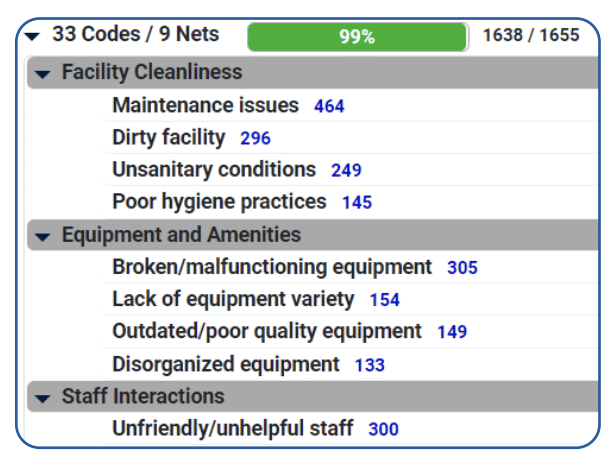
Theme Extractor 2.0 is Ascribe’s latest AI-powered innovation, designed to automatically analyze open-ended comments and survey responses with an accuracy of over 95%. It generates a human-like, richly descriptive codebook with well-structured nets, allowing users to spend less time on the technical aspects of analyzing open ends and more on interpreting results. By using Artificial Intelligence (AI) and Natural Language Processing (NLP), the tool navigates the complexities of text analysis, dramatically reducing manual analysis and delivering results with incredible speed.
Check out the theme-based codes and nets in the following snapshot of results, delivering a significant improvement over the one-word topics used in older technologies. A total of 1655 responses were analyzed, and 1638, or 99%, were immediately classified into 33 codes and 9 nets.
Benefits of Theme Extractor 2.0
1. Accelerated Workflow and Efficiency
Analyzing open-ended responses manually can be extremely time-consuming. Theme Extractor 2.0 automates this task, allowing users to process large datasets and free up valuable time for more in-depth analysis. With minimal manual intervention required, it streamlines your workflow and reduces the risk of errors.
2. Exceptional Accuracy
With over 95% accuracy, Theme Extractor 2.0 provides a level of precision that rivals human coding. By minimizing uncoded responses and overlapping codes, it ensures that your data is clean, structured, and primed for thorough analysis. You can trust that the data and insights are as accurate and reliable as possible.
3. Clear and Organized Codebook Structure
Theme Extractor 2.0 generates theme-based codes and nets that help uncover deeper patterns within your open-end responses. Say goodbye to one-word topics, and hello to helpful, descriptive results. It structures codes into clear, logical nets, making it easier for researchers to interpret data and spot key themes. These improved results add clarity to your analysis and ensure a seamless experience.
4. Minimal Manual Intervention
With minimal manual intervention needed, Theme Extractor 2.0 handles the labor-intensive tasks, allowing users to focus on more strategic work. Automating analysis allows researchers to quickly move from raw data to actionable results, saving time and reducing the risk of human error.
What is Ask Ascribe?
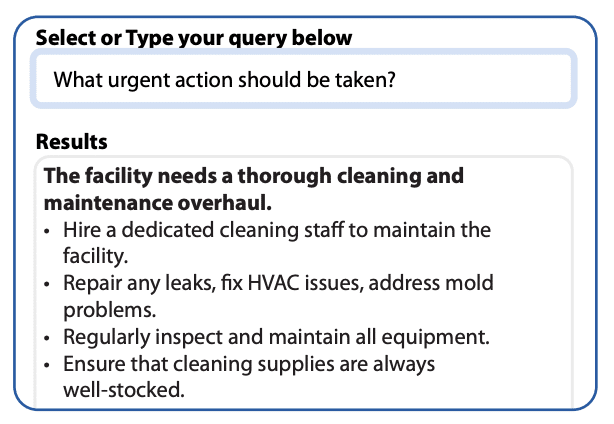
Ask Ascribe is an innovative AI-powered tool that lets you ask natural language questions about your data and get instant, actionable insights through answers, reports, and summaries. Powered by advanced Generative AI models, Ask Ascribe allows researchers to engage directly with their data, enabling them to ask specific questions and gain a deeper understanding of key themes, customer sentiments, and areas for improvement.
What is Ask Ascribe?
1. Instant Answers with Natural Language Interaction
You don’t have to sift through piles of data anymore—Ask Ascribe lets you ask natural language questions like “What are the main themes in this feedback?” or “How can I improve my Net Promoter Score (NPS)?” and receive accurate, data-driven answers in seconds. This AIpowered feature simplifies the analysis process, providing you with real-time insights into the story behind your data.
2. Uncover Actionable Insights Easily
Ask Ascribe goes beyond providing answers; it delivers actionable insights that empower you to make informed decisions. Whether you’re looking to explore customer emotions, identify pain points, or uncover opportunities for improvement, Ask Ascribe helps you quickly grasp what your data is revealing and what steps to take next.
3. Explore Data on a Deeper Level
With Ask Ascribe, you can easily drill down into responses to see the original comments tied to specific insights. This feature allows you to explore your data more thoroughly and gain a nuanced understanding of key drivers, customer feedback, and other qualitative insights. You’re not just scratching the surface—you’re engaging deeply with your data.
4. Empowers Better Decision-Making
By delivering quick, relevant answers to your questions, Ask Ascribe helps you make informed decisions based on real data. The ability to “interview” your data in real-time empowers researchers, analysts, and business leaders to respond faster and more strategically to emerging trends and customer feedback.
Why Theme Extractor 2.0 and Ask Ascribe Matter
Together, Theme Extractor 2.0 and Ask Ascribe – available as features in Ascribe’s Coder verbatim coding platform, CX Inspector text analytics and Services solutions – are changing how researchers and analysts engage with their data. By automating open-end analysis and coding processes and enabling AI-powered Q&A, these tools drastically reduce the time and effort needed to turn open-ended responses into clear results and actionable insights. Here’s why they make a difference:
- Unparalleled Speed to Results: Load up a data file or ask a question and the results appear within seconds. Now, any dataset with open-end responses of any size and complexity can be analyzed quickly and easily.
- Increased Productivity: These solutions streamline workflows by eliminating manual processes, enabling researchers to analyze more data in less time.
- Improved Accuracy: Both tools leverage advanced AI models to deliver precise, more descriptive results, ensuring you can trust the insights derived from your data.
- Deeper Understanding of Data: By offering theme-based codes and nets, and natural language interaction, researchers can dig deeper into their data, leading to more strategic decision-making.
Conclusion
The ability to transform open-ended data into clear, actionable results is essential for any organization that values customer feedback and market research. Ascribe’s Coder, CX Inspector, and Services, available with Theme Extractor 2.0 and Ask Ascribe, are powerful solutions that deliver a new level of speed, accuracy, and ease to researchers and analysts.
These solutions are the future of open-end data analysis—enabling users to unlock valuable insights with minimal effort and maximum efficiency. If you’re ready to transform how you work with data, it’s time to explore what Ascribe can do for you.
Interested in discussing how Ascribe can help you?Click here to sign up for a live demo with your data,or drop us your contact info and we will reach out to you.
11/18/24
Read more

The Latest in Market Research
Bridging the Gap: How Academic and Industry Researchers Can Learn From Each Other
Whether your environment is academic or industry, every social, market, and consumer insights expert has developed a unique set of skills shaped by their education and experience. Regardless of the depth or source of these skills, they remain, however, incomplete. With that in mind, here are some key skills that industry and academic researchers can learn from one another.
Embrace the randomness of real life
Every researcher loves a fully factorial, experimentally designed retail aisle, but those don’t exist in real life. Real-world shopping means not finding a product, brand, size, or format you’re looking for, coming upon unexpectedly low or high prices, and dealing with rude customers and employees.
Practical researchers who conduct on-site shop-alongs and ethnographies have extensive experience analyzing and interpreting complex, messy, real- life scenarios. Their hands-on experience makes their work highly relevant to business leaders needing to understand current industry needs, market trends, and consumer preferences. Real life may be messy, but academic researchers should learn to embrace a bit more mess.
Incorporate more theoretical depth
Human behavior isn’t new. For more than a hundred years, academic researchers have worked to understand market and consumer behaviors and to build theoretical foundations like Cognitive Dissonance Theory and the Diffusion of Innovation Theory that can be used to hypothesize and predict future behaviors. They’ve built on the work that came before them, knowing that it is the foundation of their own research. This is what elevates their work from simpler descriptive analyses and hypotheses to deeper understandings of who, what, when, where, why, and how certain consumer behaviors occur.
Rather than trying to understand a single problem, such as which package will be successful today, academic researchers work to build theories that will have a broader impact. By digging into the human behavior archives more often, industry researchers could also generate more robust conclusions and recommendations.
Practice agile research processes
Where academic researchers often have months or years to run a research project that accommodates a wide range of variables, industry researchers often have days or weeks. Industry researchers have learned to expect and adapt to changing circumstances so that they can meet rapid turnaround times. Their work is efficient and responsive to the real world, which can change literally overnight. Industry research is often simple and quickly actionable. Bang for the buck is clear and personally observable. Academic researchers could definitely benefit from tightening their timelines and getting their outcomes into the real world more quickly.
Engage More Stakeholders
Determining whether customers like package A or package B more is not as simple as it seems. Yes, a highly controlled experiment will reveal a winner, but simply moving forward with the results of what is essentially a customer vote could lead to a massive failure.
To ensure an experiment doesn’t land in the proverbial file drawer, industry researchers are careful to engage many of their stakeholders, including not only customers but also the package designer who will need to make any subsequent tweaks to their beloved design, the brand manager who campaigned for the losing package, the category manager who must budget for a more expensive package, the business development team who must promote a design they don’t personally like, and the executive leadership who is divided on the decision.
By engaging a cross-disciplinary team from the beginning, industry researchers have learned how to strengthen the applicability and reach of their research. Sometimes, academic researchers need to remember that uncovering truth isn’t the automatic path to success.
Take risks with new innovations
If you’re not already using AI, your competitors will pull ahead and leave you behind. That doesn’t mean you should jump onto the AI bandwagon and use it everywhere you possibly can. It does mean you should find ways to incorporate new methodologies like AI as soon as you find practical and valid uses for them.
Rather than waiting for academic researchers to complete highly controlled studies, industry researchers are incorporating AI tools and techniques for experimentation along the way. With side-by-side comparisons, industry researchers allow their customers to see and get comfortable with the results while also ensuring the innovations are valid and reliable in real life. The key is to take safe and considered risks along the way.
Value long-term learning
You’re a researcher because throughout your life, as a baby, toddler, child, teenager, and young adult, you were exposed to a set of experiences and circumstances that consciously or unconsciously led you to reject some job opportunities and choose this one. You are a lifelong experiment, not a one- time study from last week.
Similarly, academic researchers value lifelong experiences, which means that many of them conduct studies that take 5, 10, or even 50 years to complete. These studies help us understand systemic, longitudinal issues that are not visible in one-time, cross-sectional studies. Longitudinal studies are how we understand the impacts of early education on later voting patterns or early community service experiences on later-life consumer issues. Industry researchers would be well-served to take a longer-term approach to some of their studies.
Incorporate more scientific rigor
Academic researchers are rigorously trained in statistics, sampling, and research methodologies. Through years of schooling, they’ve learned to scrutinize and interpret data with a critical eye. They know when to use a Scheffé correction and why they won’t use it this time. They know the pitfalls of data tabulations and when to use Python and R scripts. Consequently, they succeed with high research quality and validity, minimal biases, and maximum reliability.
Given that many market and consumer researchers are serendipitous members of the industry and only receive on-the-job or as-needed training, this is definitely a gap that needs to be filled.
Summary
Whether you’re an academic or industry researcher, we all have knowledge gaps across a range of areas. Having a growth mindset focused on uncovering and filling those gaps is how good researchers eventually become great researchers. We would all benefit from taking a masterclass from ESOMAR or a course with the MRII, so don’t be shy. Have a look at their offerings and see how you can add new skills to your repertoire. Or, if you’d like to chat with a passionate colleague about research techniques, please connect with one of our survey experts. We’d love to hear from you!
11/8/24
Read more

The Latest in Market Research
Lessons from Past Elections: Adapting Polling Methods for Tomorrow
Introduction
As the political landscape shifts beneath our feet, polling remains a critical tool for understanding public sentiment. What if the path to more accurate voter insights lies in learning from our past experiences?
To deepen our understanding, we had a conversation with Dr. Don Levy, Director of the Siena College Research Institute, who shared valuable perspectives from his extensive experience in polling. His insights, derived from our discussion as well as his appearances on podcasts with AAPOR and WXXI News, shed light on the factors that can skew polling results.
In this blog, we’ll explore key lessons from past elections and the innovative strategies pollsters like Dr. Levy are implementing to enhance their methodologies and restore public trust.
Key Lessons from the 2016 and 2020 Elections
The polling industry has learned vital lessons that have reshaped its approach to electoral forecasting. Dr. Don Levy discusses the factors contributing to bias observed in the last two elections:
“I think we all learned a great deal from 2016, which, at this point, feels like the distant past. There was an insufficient amount of state polling during that election, and some battleground states—like Michigan, Wisconsin, and, to some degree, Pennsylvania—were not even identified as such. Additionally, some polls did not weight responses by education in that cycle. We learned from those mistakes.
By 2020, the polling landscape had changed entirely. Everyone was considering education, recognizing it as one of the key fissures in the American electorate, and there was a greater focus on several key battleground states. We were not alone in polling Wisconsin, Michigan, and Pennsylvania at that point.”
Dr. Levy identifies two critical areas for improvement:
- State-Level Polling:
Many national polls failed to accurately gauge support for candidates due to an insufficient focus on state-level data. This oversight revealed how local dynamics and voter sentiment vary significantly across different regions, leading to inaccuracies in predictions. - Education as a Variable:
The impact of education on voter preferences was underestimated in many polls. Dr. Levy notes, "Education proved to be a dividing line, especially in battleground states." This insight emphasizes the importance of moving beyond traditional demographics. Pollsters must now consider how educational background influences voter behavior to enhance the accuracy of their models.
In response to these lessons, methodologies have evolved to prioritize regional polling and implement nuanced weighting practices that better represent educational backgrounds. By learning from past missteps, pollsters are striving to produce more reliable results, thereby reinforcing the credibility of polling as a tool for democratic engagement.
This recognition of education as a crucial variable, alongside the emphasis on state-level insights, marks a significant shift in voter sampling approaches. The goal now is to capture a clearer picture of public sentiment, ensuring that polling remains a trusted resource in the ever-changing political landscape.
Addressing Challenges with Innovative Approaches
In response to recent election cycles, pollsters have made significant strides to tackle key challenges. Dr. Levy highlights how these adjustments contribute to better accuracy and engagement:
- Achieving Diverse Representation Through Stratified Sampling: Pollsters use stratified sampling to ensure diverse representation across demographics, selecting sample groups that mirror the broader population—not only by age, gender, and race but also by considering regional and socioeconomic nuances. This helps create a more accurate model of voter intentions.
“We faced a bias in 2020. Our view was that ardent Trump voters—not the shy ones—tended not to respond to polls. This issue was evident across all polling methods: phone, web-based, text-to-web, and IVR. In analyzing about 50 polls from reputable AAPOR members in the ten days before the election, only three correctly predicted outcomes or leaned Republican, while nearly all others were biased the other way.
In Pennsylvania, for instance, areas with the highest Trump support showed significant polling errors. In regions where Trump won by 70% to 30%, polls often showed him at around 60% to 40%. But systemically, what occurred was that as we filled our quotas, we would just simply get a greater participation among Biden voters who were, to stereotype, white men without a college education than from a representative sample of Trump voters.
So, do we face that threat again this election? Yes. To address it, we’re implementing rigorous quota management, stratified sampling, and actively reducing drop-offs, along with the benefit of a repeat election.”
- Minimizing Drop-Offs by Leveraging Historical Data and Voter Lists: Pollsters have also become more vigilant about minimizing drop-offs, aiming to retain as many responses as possible to enhance data robustness. "Drop-offs can skew results by unintentionally filtering out certain groups," says Dr. Levy. As a solution, historical data and detailed voter lists have become valuable tools, allowing pollsters to refine their models and develop weighting strategies that are more reflective of the electorate. This approach helps account for variances in response rates, especially among underrepresented groups.
- Increasing Voter Engagement using AI and Data Enhancement: With advancements in artificial intelligence and data enhancement, pollsters now have more sophisticated tools to reach and engage voters, even as response rates remain challenging. AI-driven insights can optimize contact strategies, enabling pollsters to identify when, where, and how to engage different voter groups effectively.
These innovations collectively improve polling accuracy, reinforce public trust, and ensure that polling remains a valuable tool in capturing voter sentiment.
Upholding Integrity: The Importance of Non-Partisan Polling
In commitment to Non-Partisan Polling, maintaining public trust is paramount, and organizations like the American Association for Public Opinion Research (AAPOR) are essential in promoting transparency and upholding high standards in the polling industry. Dr. Levy highlights that these organizations work to enhance public understanding of non-partisan polling, which serves as a critical check against potential biases that can arise in politically charged environments.
“My hope—and my request—to my friends in the polling community is to broadcast to U.S. citizens and voters, explaining who we are, what we do, and why it’s important. It would be a positive act of citizenship to participate in high-quality, non-partisan political polls. We're not trying to sell you anything, convince you of anything, and/or manipulate you in any manner, shape or form.”
Pollsters are committed to contributing positively to the democratic process by fostering greater transparency around polling methods, data sources, and any limitations that may impact findings. Through collaboration and innovation, the polling industry continues to adapt and improve, addressing new challenges with integrity. As the political and social landscape evolves, the industry’s focus on high standards remains steadfast, ensuring that polling serves as an informative, unbiased reflection of public sentiment and helps advance informed democratic engagement.
Conclusion
Reflecting on the lessons of recent elections, it’s evident that the future of polling depends on how well the industry adapts and innovates. By embracing better sampling techniques and new technology, pollsters are working to paint a truer picture of where voters stand and what they care about. The path forward is one of continuous learning and evolution, ensuring that polling remains a trusted tool for understanding public sentiment.
11/4/24
Read more

Text Analytics & AI
The Value of Open-End Analysis in Market Research: Transforming Open-Ended Questions and Analysis for Market Researchers
Open-ended questions and analysis provide a rich layer of insights that goes beyond the limitations of structured data, offering a clearer understanding of customer sentiment, emerging trends, and overall experience. Whether gathered from surveys, customer reviews, or social media, this feedback can be a goldmine for business insight—but analyzing it effectively can be a challenge. For those dealing with thousands of open-ended questions and responses, traditional methods such as reading through open ends, tallying up responses in Excel, or simply not having the capacity or the right tools to analyze the feedback becomes overwhelming. Additionally, using generic AI tools like ChatGPT often proves inadequate. Without a qualified solution to easily analyze open-ended responses, researchers risk generating incomplete or inaccurate results, which can lead to delays and inefficiencies in completing projects.
At Voxco, one of the reasons we are excited about integrating Ascribe into our online survey platform is because of how Ascribe’s Coder and CX Inspector simplify and streamline open-end analysis, especially for corporate and market researchers. These tools leverage the latest advancements in artificial intelligence, making it easier to unlock actionable insights from vast amounts of open-ended data. This exciting product release showcases our joint commitment to offering innovative solutions that help researchers drive more impactful decisions.
Why Open-Ended Questions and Analysis Matter
- Deeper Customer Insights: Open-end analysis delivers a more comprehensive view of customer behaviors, motivations, and sentiments, helping companies better understand their audiences
- Uncover Hidden Insights: Open-ended responses can reveal unexpected insights that structured data misses, offering an early window into new trends and opportunities.
- Capture Nuances: Unlike structured responses, open-ended feedback allows customers to express their feelings and experiences in their own words, providing valuable context that helps businesses understand emotional drivers and pain points.
- Identify Emerging Trends: By analyzing open-ended feedback, businesses can spot new patterns that may not have been considered in the initial survey design, allowing them to respond quickly.
- Understand the ‘Why’: While quantitative data shows what’s happening, open-end feedback reveals why customers behave the way they do, offering more actionable insights.
How Ascribe’s Coder and CX Inspector Can Help
Ascribe’s industry-leading tools enable the analysis of open-ended feedback at scale with greater accuracy and speed by seamlessly blending artificial intelligence with human expertise. Here’s how Ascribe Coder and CX Inspector, both recently upgraded with Theme Extractor 2.0 and Ask Ascribe, empower researchers:
Theme Extractor 2.0
Automatically analyzes over 95% of open-ended responses and generates accurate, human-like codebooks. The tool eliminates overlap between themes and delivers cleaner, faster results—ideal for streamlining the research process.
Ask Ascribe
Ask Ascribe allows users to query their data in real-time using natural language. This interactive approach enables the quick identification of key themes, emotions, and areas for improvement, allowing businesses to act on insights faster.
Ascribe Coder: Enhancing Coding Productivity
Ascribe Coder enhances productivity by converting unstructured text into structured data. Here’s how:
- AI-Driven Human Coding: Combines AI with human intelligence to accelerate the coding process while maintaining precision.
- Customizable Automation: Allows users to adjust the level of automation based on project needs, ensuring control over cost, timing, and accuracy.
- Data Integration: Integrates open-ended feedback with survey data, providing a 360-degree view of the customer experience.
CX Inspector: Advanced Text Analytics for Deeper Insights
CX Inspector offers a robust platform for extracting and visualizing themes, sentiment, and emerging trends from open-end responses. Key features include:
- Instant Theme Extraction: Automatically identifies clear, descriptive themes from open-ended responses.
- Sentiment Analysis: Detects and visualizes customer sentiment instantly, enabling businesses to prioritize issues based on emotional impact.
- Actionable Insights: Combines theme detection and sentiment analysis to deliver clear, actionable insights that can be shared easily via dashboards and reports.
Conclusion: Unlock the Full Potential of Open-Ended Questions and Analysis
At Voxco, joining forces with Ascribe is part of our mission to empower researchers with powerful tools for analyzing open-ended feedback. As Rick Kieser, Chief Strategy Officer at Voxco, explains:
“Ascribe has dedicated 25 years listening to customer feedback and analyzing open-ended feedback, partnering with the world’s top market research firms and industry-leading corporations. By closely listening to the needs of these pioneers and continuously evolving, Ascribe has delivered cutting-edge solutions that shape the future of text analytics. The launch of Theme Extractor 2.0 and Ask Ascribe represents the pinnacle of this expertise—a culmination of decades of innovation, hard-earned insights, and the processing of over 6 billion customer comments. We’re excited to bring these solutions to Voxco’s customers and continue pushing the boundaries of innovation in research.”
With Ascribe Coder and CX Inspector, researchers can efficiently categorize and act on open-end feedback, driving more informed decisions and enhancing the overall customer experience.
10/28/24
Read more

The Latest in Market Research
The Pitfalls of Binary Thinking in Research and Marketing
Quantitative research is qualitative research in disguise
Whether you’re a market, academic, or social researcher, most human behavior researchers have a preference and expertise for quantitative or qualitative data collection tools. We tend to have preferences between focus groups and questionnaires, individual interviews and eye-tracking, ethnography and biometrics. We have a well-developed hammer, and we know how to make it solve most of our research problems.
However, the human experience is 100% qualitative, and quantitative research is really qualitative research in disguise. Researchers ask people to provide answers using distinct answer boxes, not realizing that they’re asking participants to pre-code highly subjective interpretations of complex experiences into imperfectly operationalized answer options. Those pre-coded answers are neither more precise nor valid than answering open-ended verbatims which are subsequently coded by the researcher. Whether the participant codes them, or the researcher codes them, both are representations of qualitative personal experiences crammed into a box.
We like to differentiate quantitative research as being measurable, structured, and controlled when qualitative research is also very much measurable, structured, and controlled. We like to say qualitative research is rich and in-depth when quantitative research can also be rich and in-depth. When well conducted, both qualitative and quantitative research give people the opportunity to reveal their underlying emotions and motivations. Quantitative research sometimes offers scale and statistical power, but the rest can be quite similar.
What can research users and practitioners do? Most importantly, we need to recognize that neither method is more valid, useful, nor important. It’s irrational to prioritize results from one method over the other. Second, research practitioners and users should have more than a basic level of training in both qualitative and quantitative research. It’s never a flex to be fluent in one method and mostly ignorant of the other. This only limits a researcher's perspective, problem-solving capabilities, and robustness of their findings.
Probability Sampling: A More Rigorous Form of Nonprobability Sampling
When it comes to choosing between probability and nonprobability sampling of human beings, the reality is that just about all sampling is nonprobability sampling. There are very few cases in which every member of population is known and every randomly selected participant consents. Probability sampling exists further along the continuum of nonprobability sampling.
For example, every student registered at a school can be identified but forcing a random sample of that population to participate in a study is impossible. Similarly, even with birth, death, driving, and voting records, it’s impossible to have a perfect list of every citizen in a city and subsequently force a random sample of those people to participate in a study. People will always be accidentally excluded and many who are included will not consent to participate. Nearly every attempt to achieve probability sampling with people is in fact an example of more rigorous nonprobablity sampling.
Regardless, probability sampling isn’t inherently superior to non probabliity sampling. Errors of sampling, data analysis, and interpretation creep into both methods. All participants behave on a continuum of honesty, attention, and care.
What can research users and practitioners do? In the end, the best sample is that one that is best suited for the job. Nonprobability samples are ideal for exploratory research, pilot studies, case studies, niche populations, trending, product testing, and, of course, working within time and budget constraints. If you require more precise statistical extrapolation such as for political polling, policy evaluation, market entry analysis, or demand forecasting, methods that approach probability sampling are preferred.
Every extrovert is an introvert
We love to classify people as male or female, introverted or extroverted, or online or offline shoppers. Our research results are massive collections of artificial, human-made binaries. But the human experience, even the most discrete physical attribute, exists on a continuum.
Binary groupings have a purpose and can be extremely helpful but it’s important to remember that we arbitrarily create the cut-points that become those binary groupings. We choose those cut points out of convenience not because they’re ‘true.’
No matter how we classify people into personality, demographic, shopping, social, or other groups, those groupings are artificial and they exist on a continuum. A group of ‘introverts’ could be subdivided into introverts and extroverts. And that subgroup of introverts could again be subdivided into introverts and extroverts, rinse and repeat. Being classified as a premium or budget shopper differs by who you’re shopping with, the product category, the time of day, and whether you’re hungry. Being classified as rural or urban can depend on political, national, local, and other characteristics.
What can research users and practitioners do? Remember that data tabulations are arbitrary and changeable. They can be redesigned once, twice, and thrice after the preliminary data has been reviewed. Design your initial tables with twice as many groups as will be necessary even if the sample sizes will be too small. With tables in hand, then you can evaluate the results and decide how many groups make sense and whether those groups should be equally sized.
Conclusion
Most binaries are arbitrary. They are human defined, human applied, and can be recoded into innumerable meaningful groups. While they are essential for simplifying the complexities of our world, every binary representation gives researchers a fresh opportunity to pause and question other equally valid categorizations that might exist. Questioning binaries is an important technique for researchers and marketers who want to reveal and explain the true complexities of consumer behaviors and preferences, ultimately improving the accuracy and relevance of marketing insights.
10/2/24
Read more

The Latest in Market Research
Navigating Data Quality in the Market Research AI Landscape
I’ve just crossed the six-month mark at Voxco and it’s been a whirlwind of a journey! I am loving getting to know all the people on our team, how they help our customers with a huge range of needs and challenges, and the potential we have together.
When joining a company as their new CEO, one of the first things I like to do after connecting with my team is to meet our customers, listen to industry experts, and hear from a broad range of stakeholders. What’s important to them? What challenges do they face? What gets them excited about going to work every day?
In talking with people at industry shows like Quirks and AAPOR, I immediately saw that AI has been embraced as a transformative market research technology that warrants significant investment. Exploring the capabilities of generative AI for enterprise applications can further revolutionize market research, enabling businesses to uncover innovative insights and optimize their decision-making processes. People are genuinely committed to the technology. For instance:
- A vast majority of trade show exhibitors have taken AI-forward approaches. And, at least partially because this is what conference committees are seeking, presenters too are taking an AI-forward approach.
- Whether their key services include data quality, sampling, analytics, reporting, or something else, most research providers are actively running internal AI projects, often leveraging tools like AI Chat to enhance their processes. About half of those projects are purely experimental but the other half are already customer-facing and revenue- generating.
Showing and discussing applications of AI in market research, however, is just noise. We need to understand the type and magnitude of impact that AI technologies have. In order to avoid long-term harm, we need to proactively measure, understand, and work toward preventing the misuse of AI. This can happen in several different ways.
- Poor data input: Generative AI has many strengths, but it can also lead to data quality issues. Just as a data analyst knows that poor sampling practices and small sample sizes create large error rates and minimal generalizability, the same is true for GenAI. “Hallucinations” destroy validity, generate incorrect insights, and lead to poor business decisions. AI researchers need to identify and prevent all types of substandard data practices that can mislead AI processes. Companies that outsource digital marketing should be particularly cautious, as the quality of AI-generated content can significantly impact their online presence and brand reputation.
- Misplaced applications: Because AI is amazing in many circumstances, it’s easy to run with it rather than trusting our gut and years of experience. Sometimes, training data doesn’t include the core data needed for making correct inferences. Sometimes we use a generalist AI tool over a research-specific AI tool. Researchers need to address the strengths and weaknesses of any AI tool they use to ensure unconscious biases that lead to incorrect business decisions are avoided.
- Lack of validation: Researchers love data, experimentation, and validation. However, AI is still developing, and there's limited market data to validate new techniques. We don’t yet know if an approach that worked for one ad test will be effective across categories, target audiences, regions, and objectives. This calls for extensive documentation and robust databases.
Of course, there are some immensely valuable and already validated uses for AI tools. Tools like Ascribe (newly acquired as part of the Voxco platform) have already helped the research industry solve a long- running problem of avoiding coding open-ends simply because of time and cost constraints. Given that many questionnaires have ten or more short open-ends plus several long open-ends, this used to be a disappointing waste of respondent time and a loss of valuable insights for brands. This is one big problem solved.
I look forward to seeing how AI continues to evolve to create better business operations, research processes, and exceptional customer experiences. With a proactive approach to quality and validation, the opportunities are endless. I’d love to learn about your AI experiences so please feel free to connect with me on LinkedIn or talk with one of our survey experts.
9/18/24
Read more

Text Analytics & AI
How Can I Create Visualizations From My Open-Ends?
Qualitative data, especially open-ended responses, can provide deep insights into consumer behavior, preferences, emotions, and desires. However, extracting actionable insights from qualitative data is more difficult than briefly skimming through survey responses or counting frequency, instead, it requires quantitative analysis of the open-ended responses in your data set and then effective visualization of the results.
The Power of Visualizations
Visualizations play a crucial role in transforming raw, unstructured data into meaningful insights to help drive business decisions. When it comes to open-ended responses, visualizing the data with infographics, charts, and other visual options helps with identifying patterns, trends, and sentiments that may not be immediately apparent from reading the text alone.
Visual tools have the ability to take vast, complex amounts of qualitative data like consumer comments and transform it into easily digestible, visually appealing formats. By presenting data in this way, these tools enable you to quickly identify key themes and ideas that might otherwise be buried in lengthy text responses. This streamlined approach not only saves time but also enhances your ability to make informed, data-driven decisions with confidence, ensuring that critical insights from your respondents are not overlooked.
Understanding Your Open-End Data
Before creating your data visualizations, it’s essential to understand the nature of your open-end data. Open-ended responses often vary in length and complexity, ranging from short, single-word answers to detailed narratives. This variability makes it necessary to prepare your data carefully to ensure accurate and insightful visualizations.
Preparing Data for Visualization
Preparation is a critical first step in the data visualization process. This phase involves not only the collection of data but also a thorough review and organization of that data to ensure it’s ready for effective visualization.
Initially, it’s essential to gather all relevant data from your surveys, interviews, or other qualitative research sources. Once collected, the data needs to be carefully reviewed, which includes cleaning and organizing the responses. This might involve filtering out irrelevant, duplicate, or "spam" responses that could skew your results, ensuring that only accurate and meaningful data is included in your analysis.
Next, responses should be classified into themes, which is the process of categorizing similar pieces of information under unified topics or concepts. This helps to distill large amounts of qualitative data into more manageable and understandable segments. Additionally, tagging specific segments of responses that are particularly relevant to your analysis can help highlight key insights and trends that align with your research objectives.
It’s also important to consider the context of your data, especially in relation to the research questions your organization has posed. The framing of these questions can significantly influence the way responses are interpreted. By keeping these questions in mind, you can ensure that your visualizations will address the core issues you set out to explore.
Proper preparation lays the groundwork for creating visualizations that accurately reflect the underlying sentiments and themes within your data. This meticulous approach not only enhances the clarity and effectiveness of your visualizations but also provides a robust foundation for deeper data analysis, enabling you to draw more reliable and actionable insights from your quantitative and qualitative research questions.
CX Inspector: A Leading Data Visualization Tool
When it comes to visualizing open-end data results, CX Inspector stands out as a top tool for researchers and analysts. CX Inspector is designed to simplify the complex process of quantitative and qualitative data analysis. Offering advanced features like generative AI and theme extraction, combined with its intuitive interface and powerful analytical capabilities, CX Inspector allows you to import, analyze, and visualize the results with minimal effort, making it an indispensable tool for any research project with qualitative data like open end responses.
Theme and Sentiment Analysis for Qualitative Data Visualization
One of the most effective ways to visualize open-end data is through theme and sentiment analysis. These techniques help you identify the underlying patterns and emotions in your data, which can then be represented visually. Here are some popular methods:
Word Clouds
Word clouds are a simple yet powerful way to visualize the most common words or phrases in your open-end responses. They provide a quick overview of the key themes by displaying words in varying sizes based on their frequency. While word clouds are great for initial exploration, they may oversimplify the data, so it's important to use them in conjunction with more detailed analyses.
Thematic Clustering
Thematic clustering involves grouping similar responses into clusters based on shared themes. This method is particularly useful for identifying patterns and trends in large datasets. By visualizing these clusters, you can easily see which themes are most prominent and how they relate to one another.
Network Diagrams
Network diagrams are another advanced visualization technique that shows the connections between different themes or keywords in your data. These diagrams are especially useful for understanding the relationships and interdependencies between various concepts, providing a more nuanced view of your data.
Frequency Distribution Graphs
Frequency distribution graphs, such as bar charts or histograms, are ideal for visualizing the prevalence of specific themes or sentiments in your open-end data. These graphs provide a clear, quantitative representation of how often certain responses or themes occur, making it easier to compare and contrast different aspects of your data.
Best Practices for Creating Effective Visualizations
Creating effective visualizations requires more than just choosing the right tool or method. It also involves adhering to certain best practices to ensure your visualizations are clear, accurate, and actionable.
Choosing the Right Visualization Method
The first step in creating effective visualizations is selecting the appropriate method based on your research goals and the nature of your data. For example, use word clouds for a high-level overview, network diagrams for exploring relationships, and frequency graphs for detailed quantitative analysis.
Ensuring Clarity and Accuracy in Qualitative Research
Clarity and accuracy are paramount in qualitative research. Ensure that your visualizations accurately represent the data by avoiding common pitfalls like overgeneralization or misinterpretation. Always double-check your data preparation and coding processes to maintain the integrity of your insights.
Making Visualizations Actionable
Finally, your visualizations should be actionable. This means they should not only provide insights but also guide decision-making. Consider how your audience will use the research findings presented and tailor your visualizations to highlight the most critical findings.
Begin Visualizing Qualitative Data with CX Inspector
Ready to transform your open-end data into powerful visualizations? CX Inspector makes it easy to analyze, visualize, and extract meaningful insights from your surveys with qualitative data. Whether you're looking to create word clouds, thematic clusters, or frequency graphs, CX Inspector provides the tools and support you need to succeed.
Don’t let valuable insights remain hidden in your data. Start visualizing with CX Inspector today and unlock the full potential of your open-end responses.
9/16/24
Read more

The Latest in Market Research
Behind the Scenes of Polling: Navigating Voter Intentions with Dr. Don Levy
Introduction
Polling, a cornerstone of political and social research, involves much more than just asking a few questions and compiling results. It’s an intricate process, shaped by many variables that can impact the accuracy and reliability of data. At the heart of this complexity is the challenge of understanding voter intentions amidst the dynamic environment of human behavior and external influences.
To shed light on these challenges, we recently spoke with Dr. Don Levy, Director of the Siena College Research Institute and a respected figure in polling with extensive experience in the field. Dr. Levy shared invaluable insights into the world of polling, offering a detailed look at the practices and factors that influence voter intentions. His extensive knowledge, gathered from our discussion with him, as well as his podcasts with AAPOR and WXXI News, provides a deeper understanding of the methodologies that underpin effective polling.
In this blog, we will explore Dr. Levy’s insights on the challenges of understanding voter behavior, ensuring accurate responses, and achieving comprehensive representation.
Understanding Voter Behavior
A. The Challenge of Gauging Voter Intentions
Predicting voter behavior is a complex challenge that goes beyond simply counting preferences. Voter intentions are influenced by many factors, including:
- Personal beliefs: Personal factors such as individual values, experiences, and priorities can sway voter decisions in significant ways.
- Social dynamics: Social influences, including peer opinions and community norms, also generally influence voter decisions.
- Political contexts: The political climate—marked by shifts in policy, candidate profiles, and campaign strategies—further complicates the task of predicting how voters will cast their ballots.
These elements are not only diverse but also interact in unpredictable ways, making the task of forecasting election outcomes both challenging and intricate.
B. The Role of “Likelihood to Vote” in Polling Models
To navigate these complexities, pollsters often rely on the likelihood of voters participating in the election as a critical variable. This approach involves assessing not just who intends to vote but how likely they are to follow through on their intentions. Consistent voters—those who regularly participate in elections—are given more weight in polling models, reflecting their higher reliability in influencing election outcomes.
In contrast, intermittent or less engaged voters are weighted down in the models. This differentiation helps to adjust the data to better represent the population of likely voters, offering a more accurate snapshot of potential election results. By focusing on these variables, pollsters aim to refine their predictions and enhance the precision of their findings.
C. Insights from Dr. Don Levy
According to Dr. Levy, understanding and correctly applying the likelihood to vote is pivotal in managing the inherent uncertainties of polling. Dr. Levy emphasizes that by carefully weighing consistent voters and adjusting for those less likely to vote, pollsters can more effectively capture the true intentions of the electorate.
“We apply a voter’s likelihood to vote as a weighting variable. For instance, if someone has voted in every single election and they tell us they absolutely will vote, you could consider them close to a 100 percent probability. On the other hand, for intermittent voters, if they express less attention to the election during our conversation, we weigh down their response.
Evaluating the reliability of their probability is crucial. After the election, we follow up to verify if those we rated as highly likely to vote actually did, assessing our predictive accuracy over time.”
Dr. Levy’s expertise highlights the importance of these methodologies in refining polling practices and improving the reliability of election forecasts. His perspective underscores the need for continual adaptation and precision in polling techniques to address the evolving nature of voter behavior.
Addressing Honesty and Non-Responses
A. The Importance of Honest Responses
Ensuring that respondents provide truthful answers is a fundamental challenge in polling. Accurate data relies heavily on the honesty of participants, but several factors can compromise this integrity. Respondents might be influenced by social desirability bias, where they provide answers that they believe are more acceptable or favorable rather than their true opinions. Additionally, the brevity of interviews can sometimes lead to less thoughtful or more guarded responses, further complicating the accuracy of the data collected.
Typical scenarios where honesty may be compromised include sensitive topics or issues that may provoke strong emotional responses. In such cases, respondents might be reluctant to share their true feelings, thereby skewing the results.
B. The Issue of Non-Responses
Non-responses, particularly from strong supporters of specific candidates or issues, present another significant challenge. These individuals may abstain from participating due to distrust in the media or pollsters, or because they believe their responses may not be taken seriously. This reluctance can create a gap in the data, leaving certain groups underrepresented.
Distrust in media and polling organizations exacerbates this issue, leading to lower response rates from certain demographic groups. This situation is problematic because it can distort the overall representation of voter intentions and opinions, impacting the reliability of polling results.
D. Insights from Dr. Don Levy
Dr. Levy addresses non-responses and dishonesty with a multi-faceted approach. He emphasizes the importance of understanding respondents' perspectives and incorporating adjustments to account for biases and missing data. His approach involves a combination of rigorous data analysis, transparency, and continuous efforts to engage with diverse respondent groups.
“Within interviews lasting between 7 and 12 minutes, participants generally tend to be truthful. However, our main challenge revolves around non-responses. To address this, we inquire about various attitudes, including their perspectives on media and current social issues. Sometimes, we apply weights based on these attitudes to better represent the non-responsive group.
Unlike some who focus solely on specific regions like just western Pennsylvania, we take a more detailed approach, recognizing the diversity within areas, such as distinguishing between Pittsburgh and the rest of western Pennsylvania. This approach requires additional work, urging our call center staff to search for representative samples, even among the demographics least likely to respond.”
Dr. Levy’s approach highlights the ongoing commitment to improving polling practices and addressing the complexities of voter behavior and response accuracy.
Ensuring Comprehensive Representation
A. The Need for Representative Samples
Achieving a sample that accurately reflects the broader population is critical for polling organizations. Representative samples ensure that the data collected is reflective of the diversity and complexities within the entire electorate. This representation is crucial for generating accurate insights into voter intentions and behaviors.
One of the main challenges in achieving representative samples is dealing with regions that have diverse demographics. In such areas, capturing the full spectrum of views requires careful consideration and nuanced understanding of various sub-groups. Without addressing these demographic intricacies, poll results can become skewed, leading to misleading conclusions.
B. Detailed Approach to Sampling
To overcome these challenges, pollsters employ a detailed approach to sampling. Instead of relying solely on broad geographical areas, pollsters focus on understanding and accounting for regional nuances. This involves segmenting regions into smaller, more specific areas to capture the diversity within them accurately.
A broad geographical sampling approach might provide a general overview but lacks the granularity needed to understand local variations. In contrast, a detailed, nuanced sampling strategy involves breaking down regions into smaller units and applying targeted methodologies to ensure all demographic groups are represented. This meticulous approach helps in obtaining a more accurate and comprehensive picture of voter intentions.
C. Insights from Dr. Don Levy
Dr. Levy emphasizes the importance of detailed sampling in enhancing polling accuracy. According to Dr. Levy, understanding and addressing regional nuances significantly impact the reliability of poll results. He advocates for a detailed approach to sampling that goes beyond broad geographic classifications to capture the complexities of diverse populations.
"Rigorous quoting, stratified sampling, aggressively seeking to keep the drop-offs—these are all the steps that we're taking to protect against the threat of inaccurate polling results.”
By focusing on detailed sampling methods, pollsters can improve the accuracy of their results and provide more meaningful insights into voter behavior.
Conclusion
Understanding the intricacies of polling is crucial for grasping how voter intentions are measured and interpreted. We’ve explored the challenges of predicting voter behavior, the importance of honesty and addressing non-responses, and the need for comprehensive, representative samples.
Pollsters face a complex landscape, but with methods such as weighting for likelihood to vote and detailed sampling approaches, they strive to provide accurate insights. Dr. Levy's perspective highlights the ongoing efforts to improve polling accuracy and the significant role polling plays in informing democracy.
As we look to the future, Dr. Levy’s optimism about the continued evolution of polling and its impact on our understanding of public sentiment reinforces the value of behind-the-scenes processes in shaping democratic discourse.
Siena College Research Institute: A Leading Force in Public Opinion Polling
Founded in 1980 at Siena College in New York’s Capital District, Siena College Research Institute (SCRI) conducts a wide range of regional, statewide, and national surveys on political, economic, and social issues. Under Dr. Levy’s leadership, SCRI has become the exclusive pollster for The New York Times, SCRI has become a trusted polling partner for The New York Times, playing a pivotal role in shaping major pre-election polls and key issue-based surveys. SCRI’s results are regularly featured in prestigious publications like The Wall Street Journal and The New York Times, and it has been recognized as the most accurate pollster in America by FiveThirtyEight.com. As a valued Voxco customer, SCRI uses Voxco’s platform to power these critical efforts, ensuring precise, data-driven insights that shape public discourse.
9/16/24
Read more